Figure 1. Expression of LOX-PP in Y79 RB cells and hREC primary cells. A: The bar diagram represents the expression of LOX-PP in fold change relative to hRECs with a p value of 0.001. B: Western blot analysis showing LOX-PP protein expression; it was normalized with β-actin. C: The bar diagram represents the quantification of LOX-PP expression in Y79 and hRECs with a p value of 0.001. Values were
expressed as mean ± SD, n=3. (***p<0.001, **p<0.01, and *p<0.05, when compared with hRECs) (hRECs, human retinal endothelial
cells; RB, retinoblastoma).
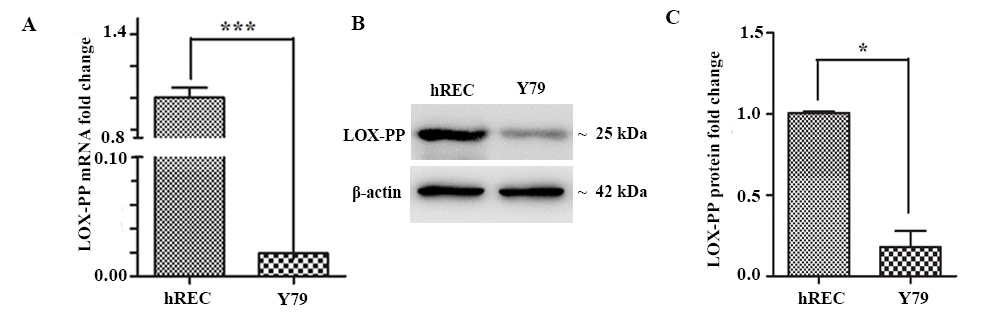
 Figure 1 of
Nagaraj, Mol Vis 2023; 29:125-139.
Figure 1 of
Nagaraj, Mol Vis 2023; 29:125-139.