Figure 5. Stromal haze thickness as a function of time. Stromal haze thickness (%) of the central cornea was significantly higher in
the CXL groups (1A and 2A) than in the controls (1B and 2B). No significant differences were observed between Group 1A and
Group 2A. * p <0.05, repeated measure two-way ANOVA followed by Tukey’s multiple comparisons test.
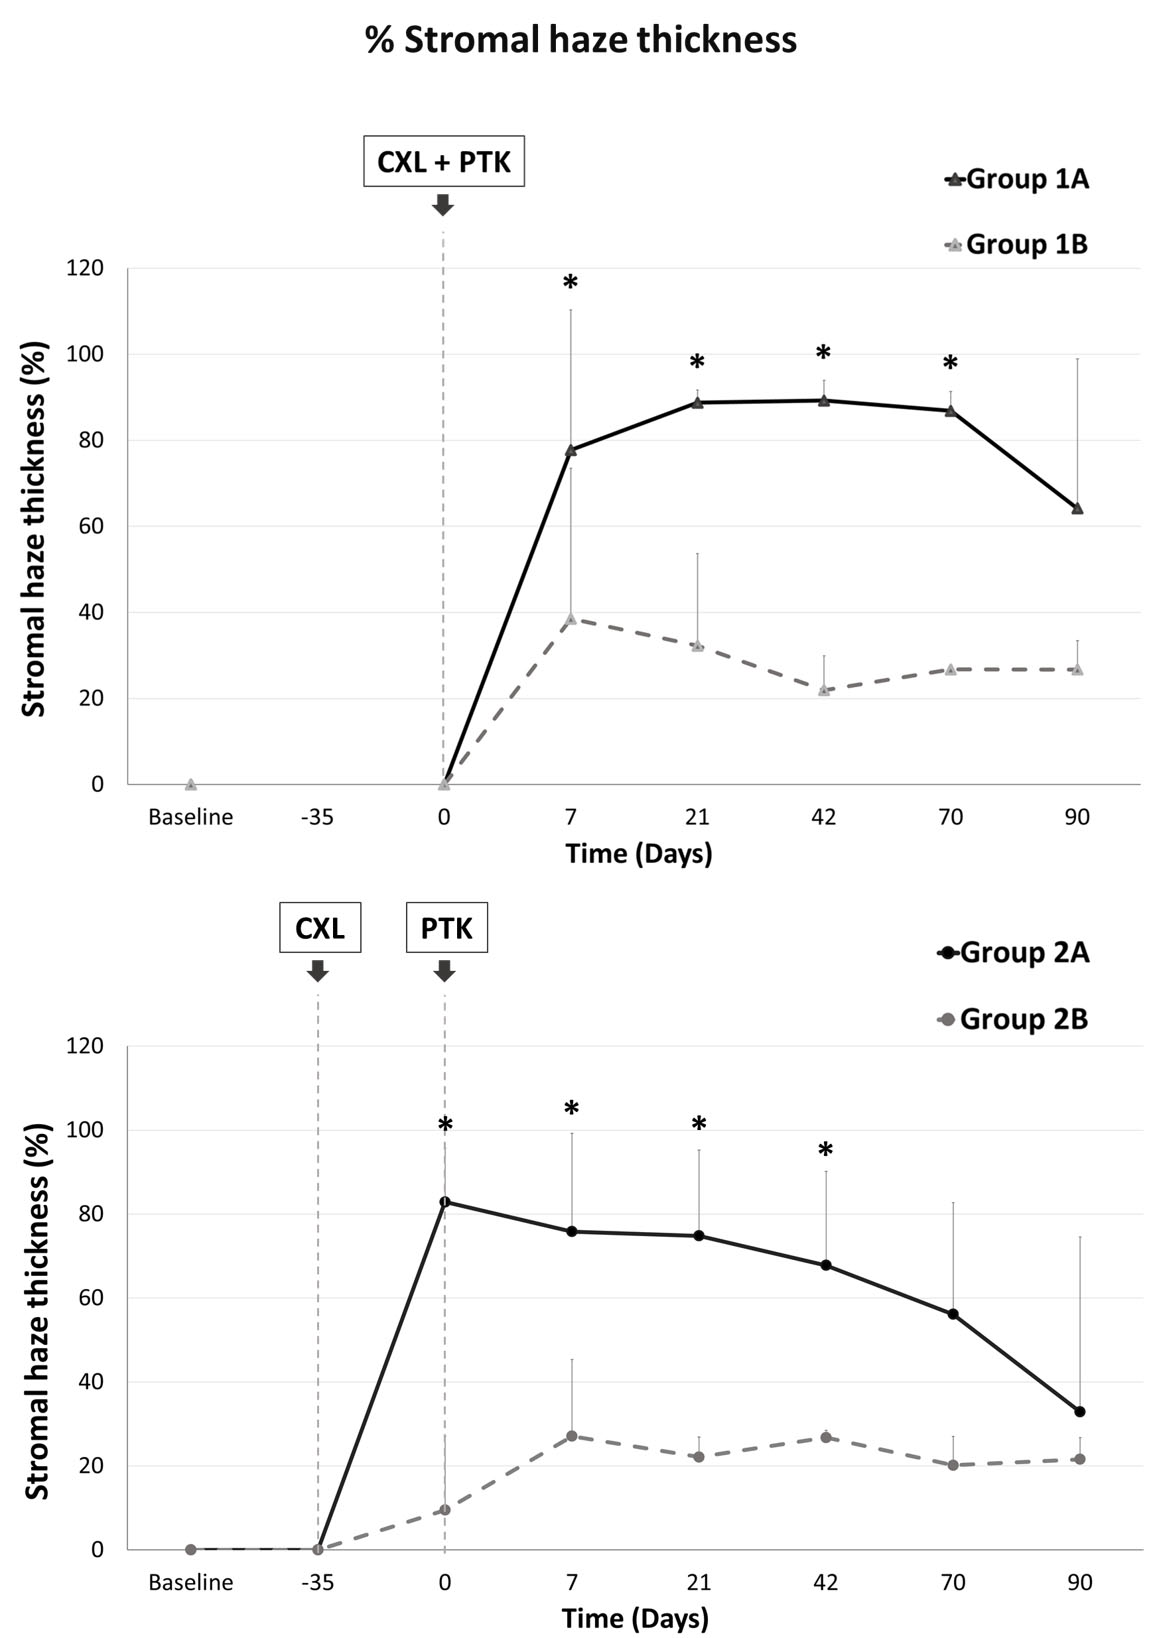
 Figure 5 of
Moore, Mol Vis 2023; 29:102-116.
Figure 5 of
Moore, Mol Vis 2023; 29:102-116.