Figure 6. Grx1 substantially inhibits ERK activation. A: Western blot analysis of phosphorylated AKT, ERK1/2, and p53 in HLE cells following treatment with 200 μM H2O2 for 24 h after Grx overexpression. B: Western blot analysis of phosphorylated ERK in HLE cells following treatment with 200 μM H2O2 for 24 h after Grx knockdown. C, D: Western blot analysis of phosphorylated ERK, BAX, cle-caspase3, BCL2, and SOD in HLE cells pre-treated with 1% PD98059 for
1 h, followed by treatment with 200 μM H2O2 for 24 h after overexpression transfection. E: Histogram of intracellular ROS levels in HLE cells pre-treated with 1% PD98059 for 1 h, followed by treatment with 200 μM
H2O2 for 24 h after Grx overexpression transfection. F: Bar graph analyses of the median fluorescence intensities of HLE cells
pre-treated with 1% PD98059 for 1 h, followed by treatment with 200 μM H2O2 for 24 h after Grx overexpression. G: Western blot analysis of phosphorylated ERK in the lens epithelium of the anterior
capsule membrane of nuclear cataract patient samples, with N2 to N4 LOCSIII scores, and control groups. The quantitative statistical
results of the western blot band intensity are labeled under the corresponding western blot band. *** p < 0.001.
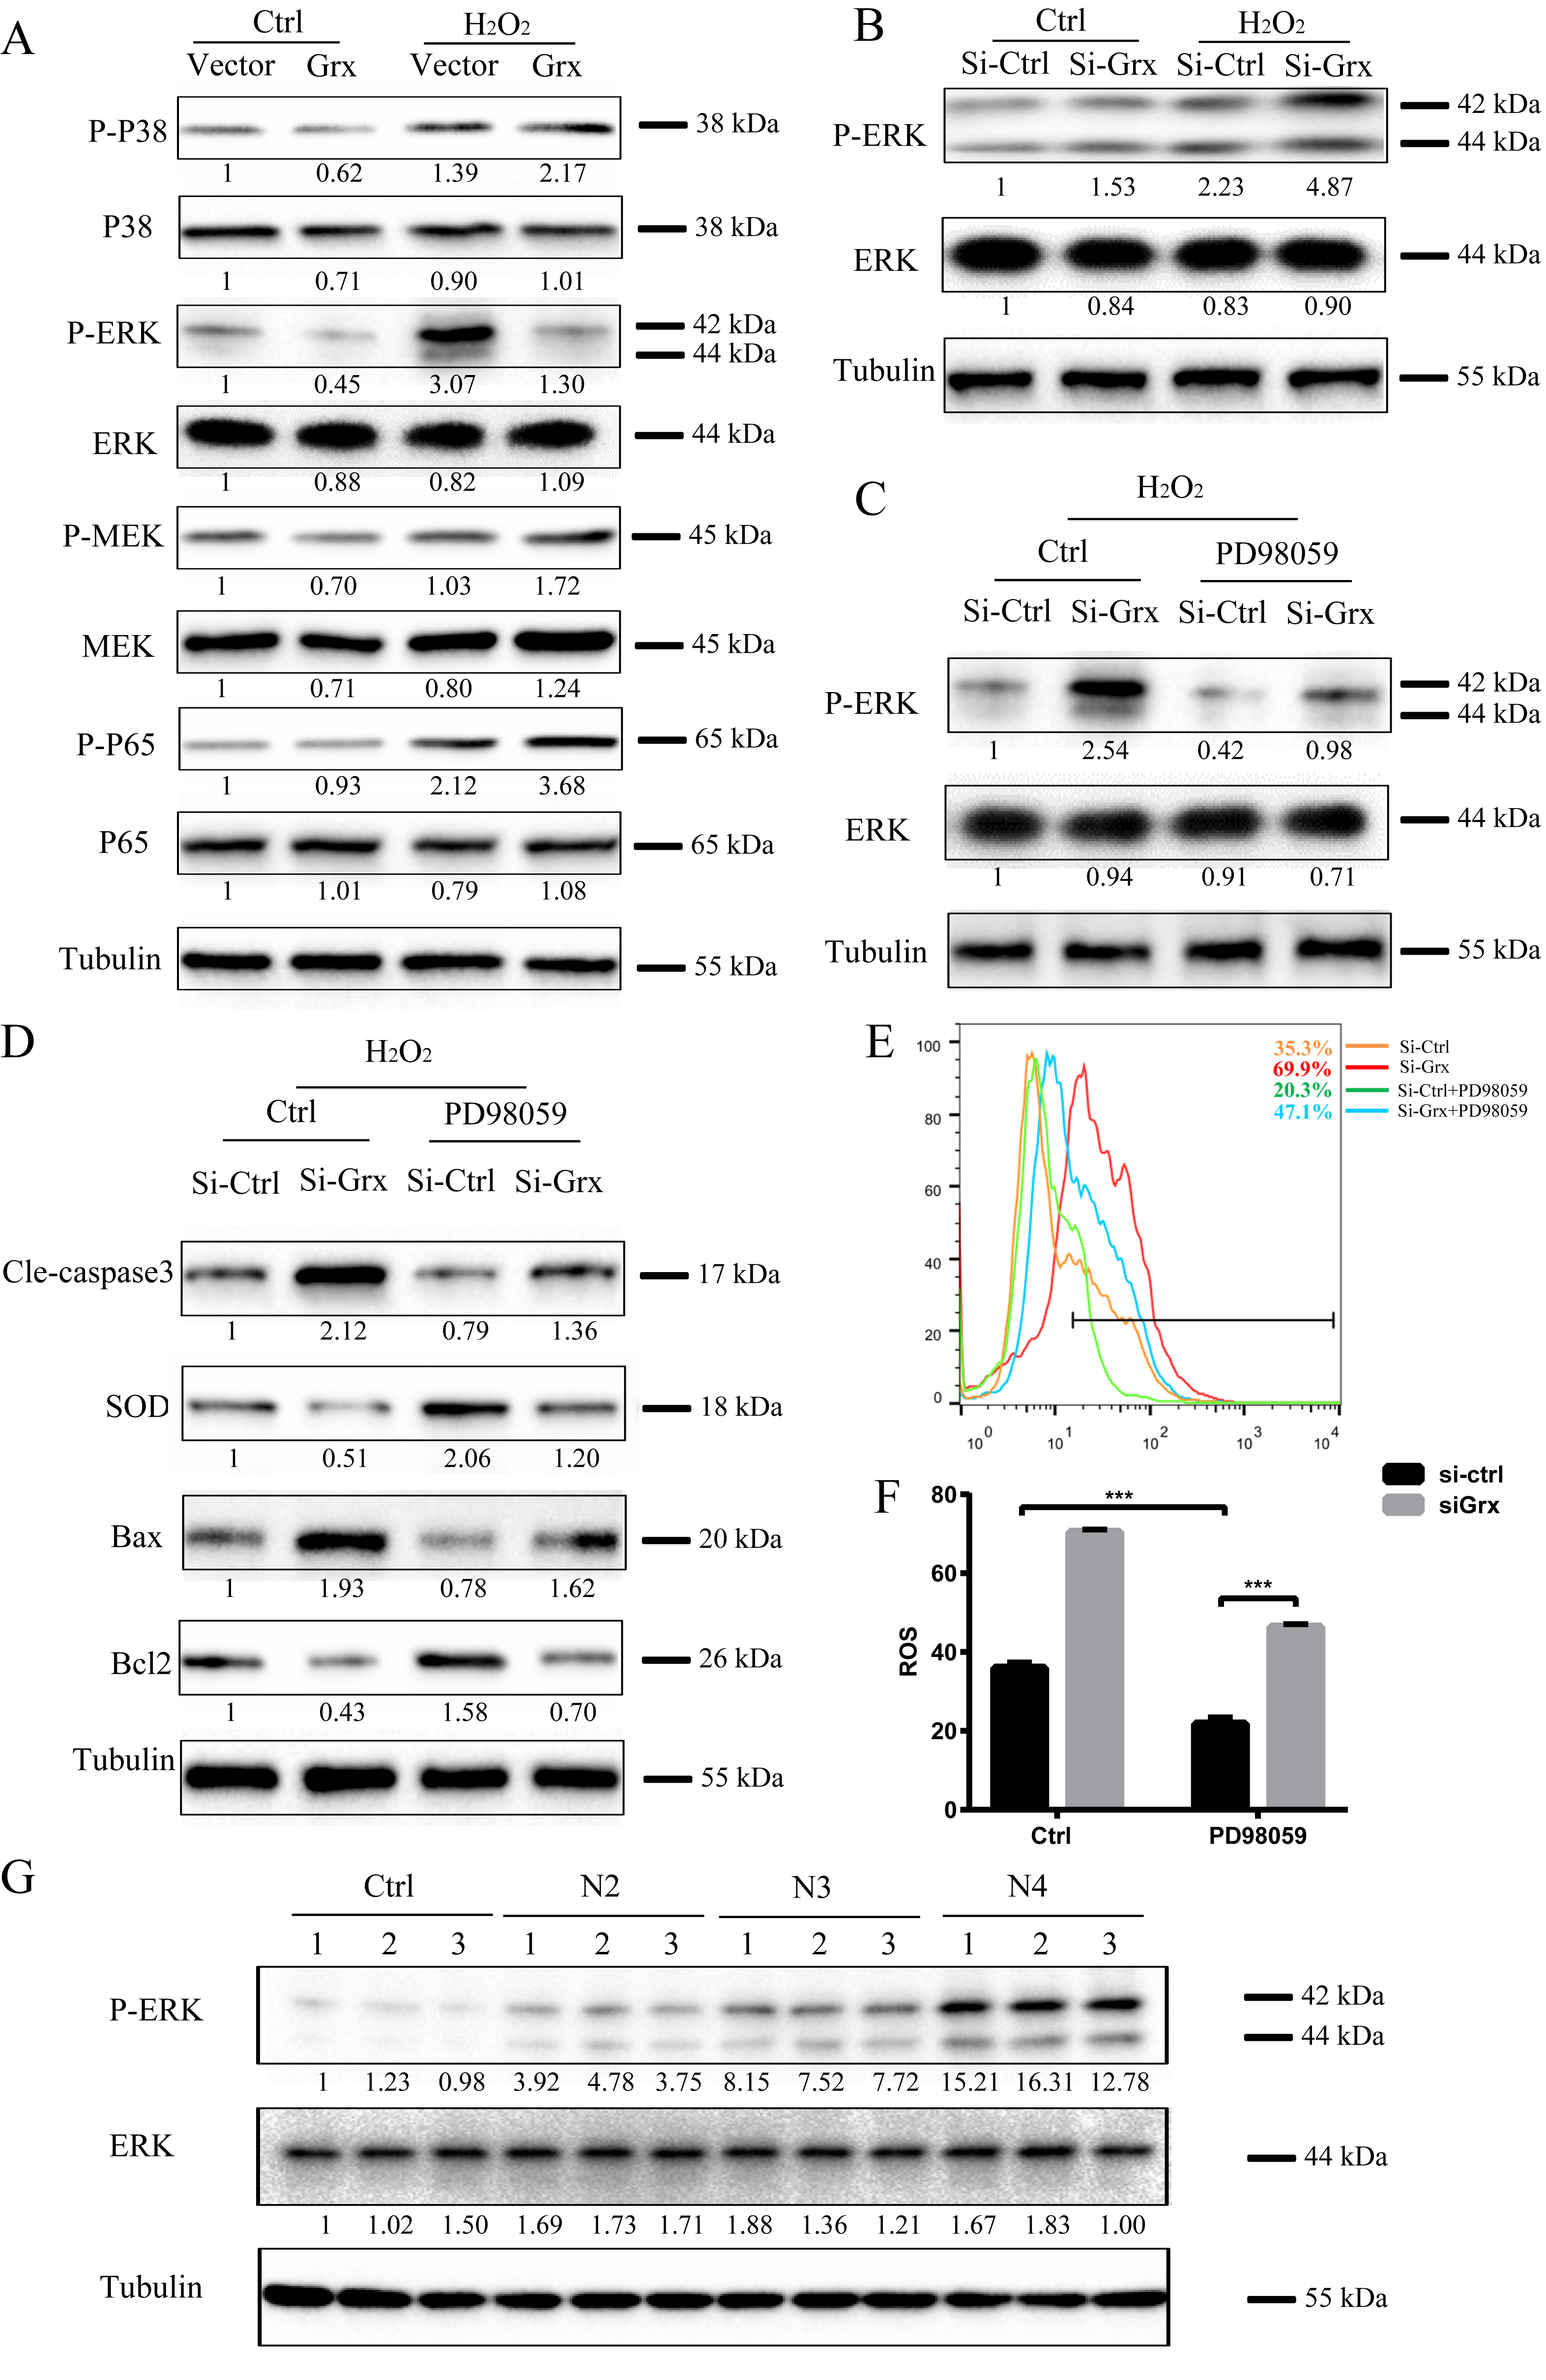
 Figure 6 of
Fan, Mol Vis 2022; 28:70-82.
Figure 6 of
Fan, Mol Vis 2022; 28:70-82.