Figure 5. Effect of Grx on intracellular ROS generation. A, C: Histograms of intracellular ROS levels in HLE cells following treatment with 200 μM H2O2 for 24 h after Grx overexpression (A) and knockdown (C). B, D: Bar graph analyses of the median fluorescence intensities of HLE cells following treatment with 200 μM H2O2 for 24 h after Grx overexpression (B) and knockdown (D). E, F: Western blot analysis of SOD expression in HLE cells following treatment with 200 μM H2O2 for 24 h after Grx overexpression (E) and knockdown (F). The quantitative statistical results of the western blot band intensity are labeled under the western blot band. *** p < 0.001.
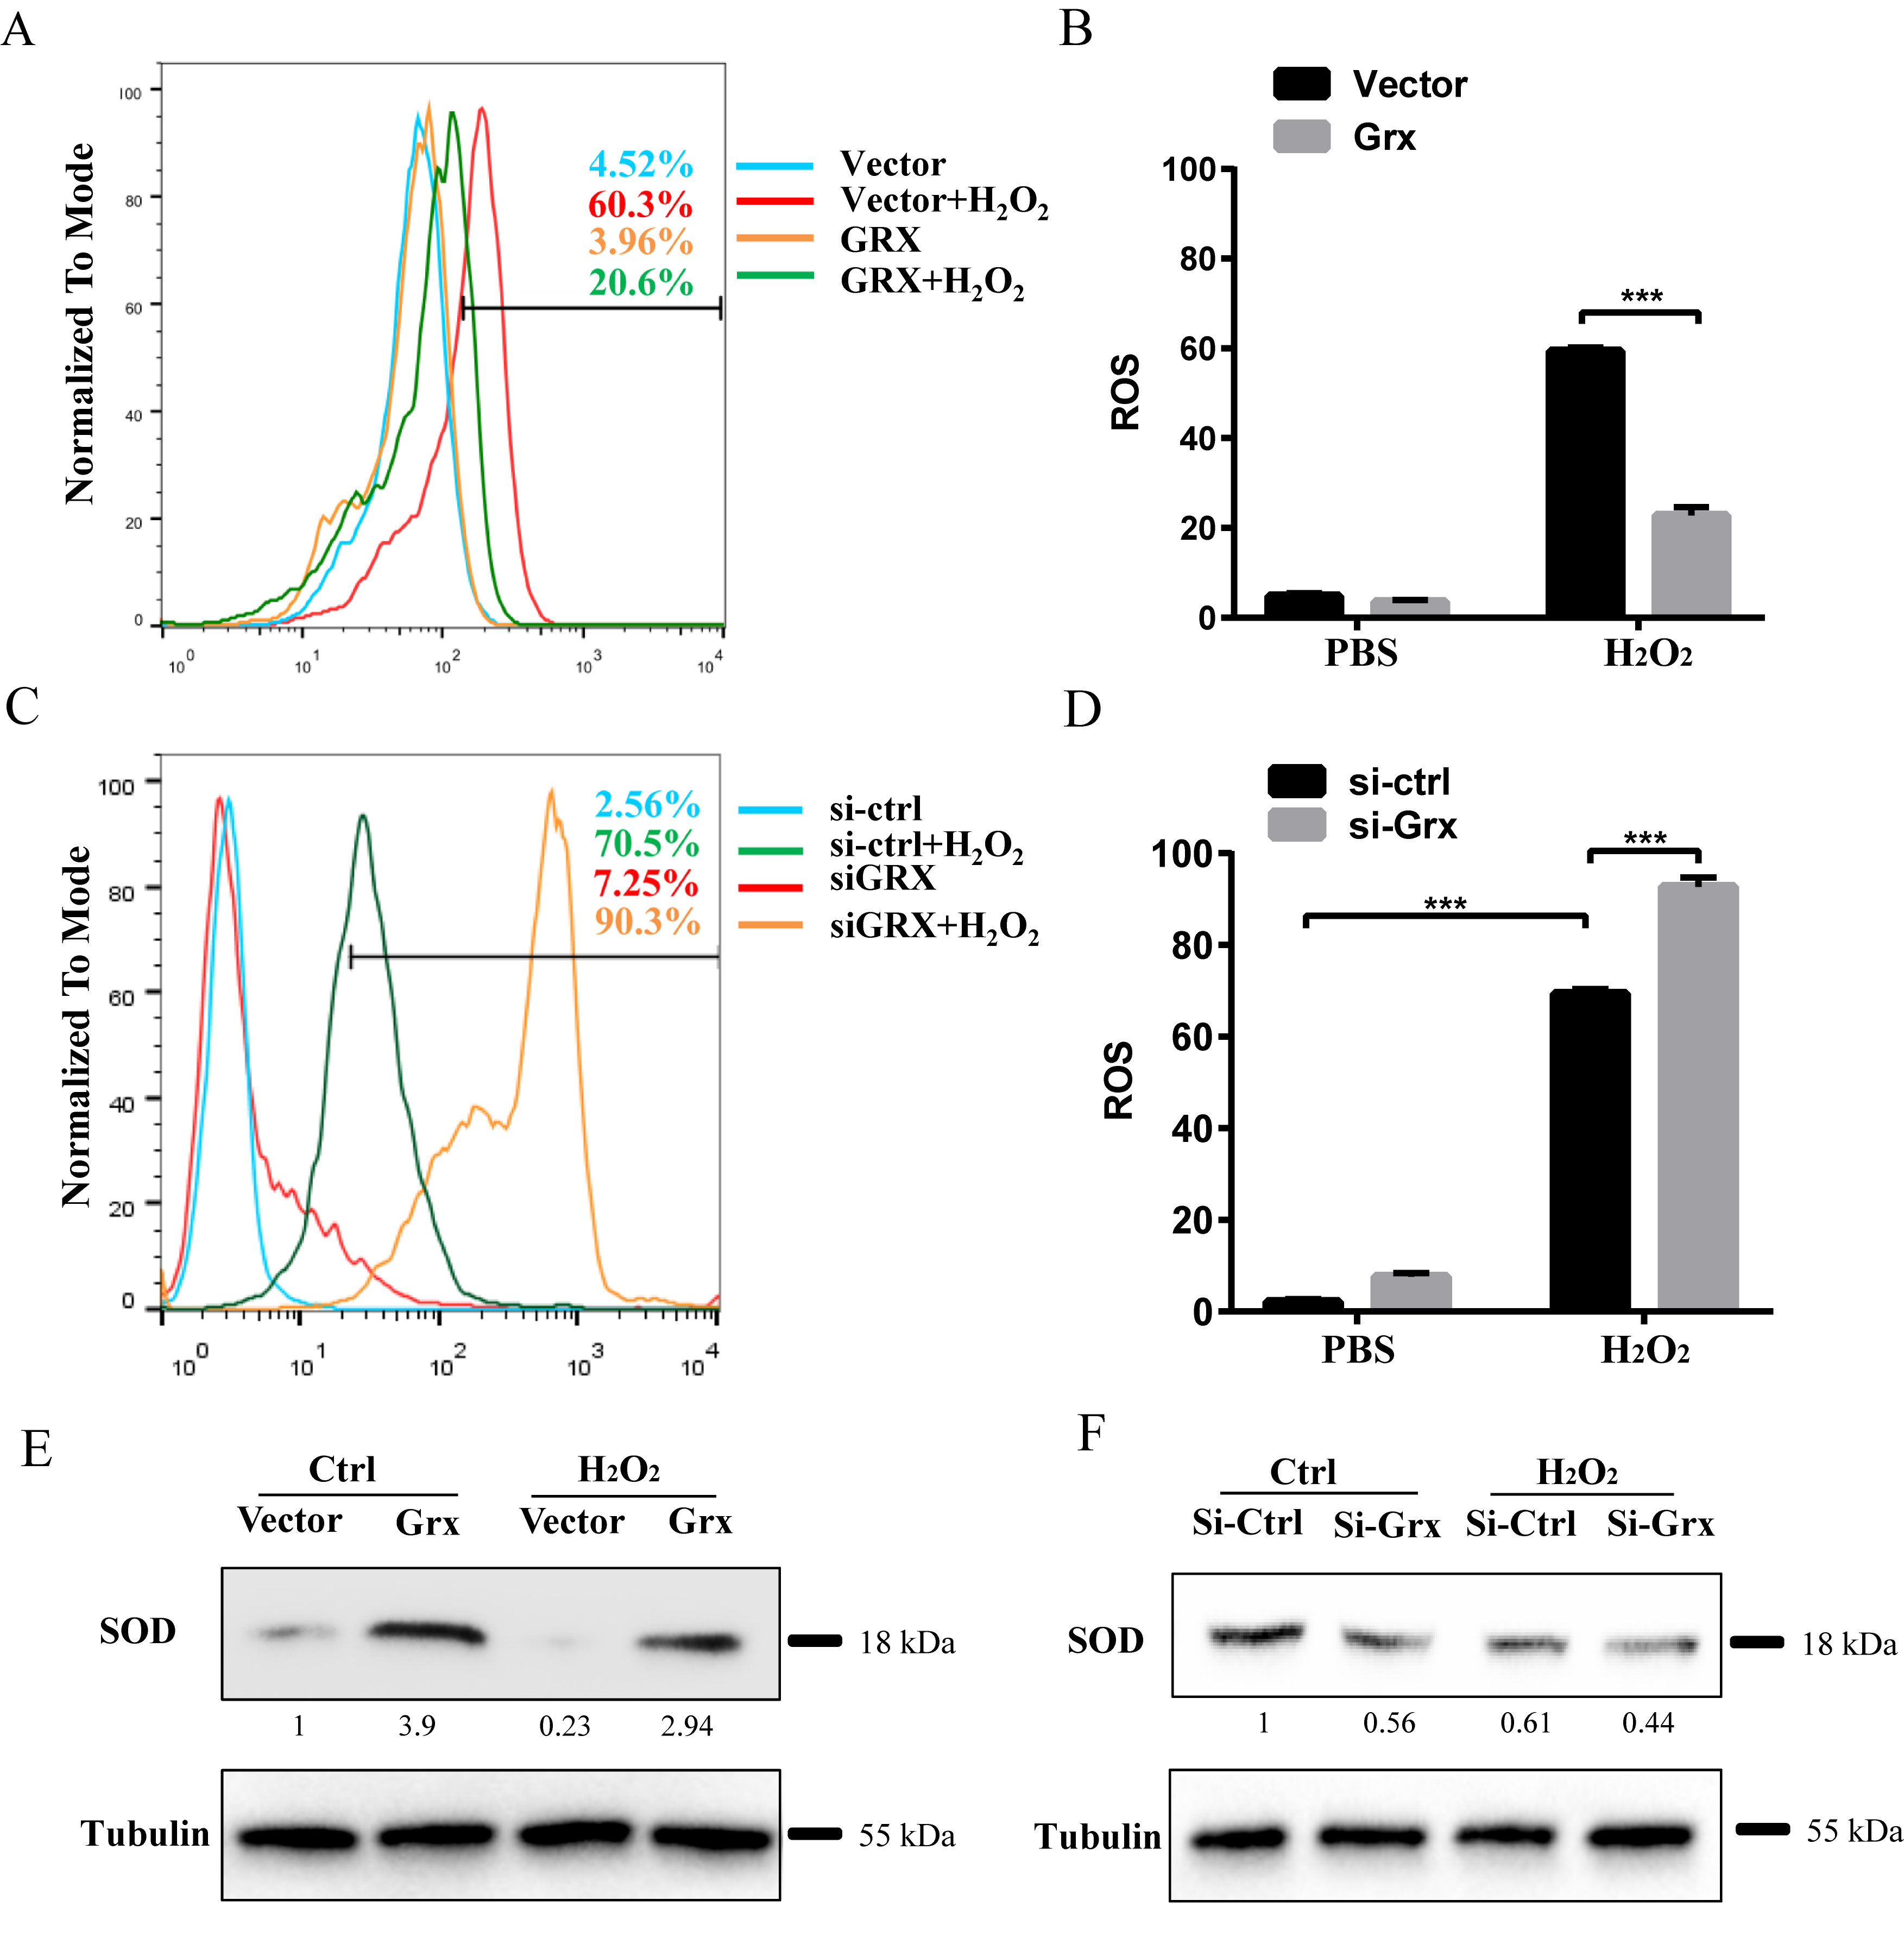
 Figure 5 of
Fan, Mol Vis 2022; 28:70-82.
Figure 5 of
Fan, Mol Vis 2022; 28:70-82.