Figure 4. Effect of Grx on cell apoptosis. A, D: Flow cytometry analysis of HLE cells following treatment with 200 μM H2O2 for 24 h after Grx overexpression (A) and knockdown (D). Early/primary apoptotic cells (Annexin V+/PI−), late/secondary apoptotic cells (Annexin V+/PI+), and necrotic cells (Annexin V−/PI+) were distinguished. B, E: Percentage of apoptotic cells following treatment with 200 μM H2O2 for 24 h after Grx overexpression (B) and knockdown (E) in HLE cells. C, F: Western blot analysis of Bax/BCL2/Cle-caspase3 expression in HLE cells following treatment with 200 μM H2O2 for 24 h after Grx overexpression (C) and knockdown (F). The quantitative statistical results of the western blot band intensity are labeled under the corresponding western blot
band. *** p < 0.001.
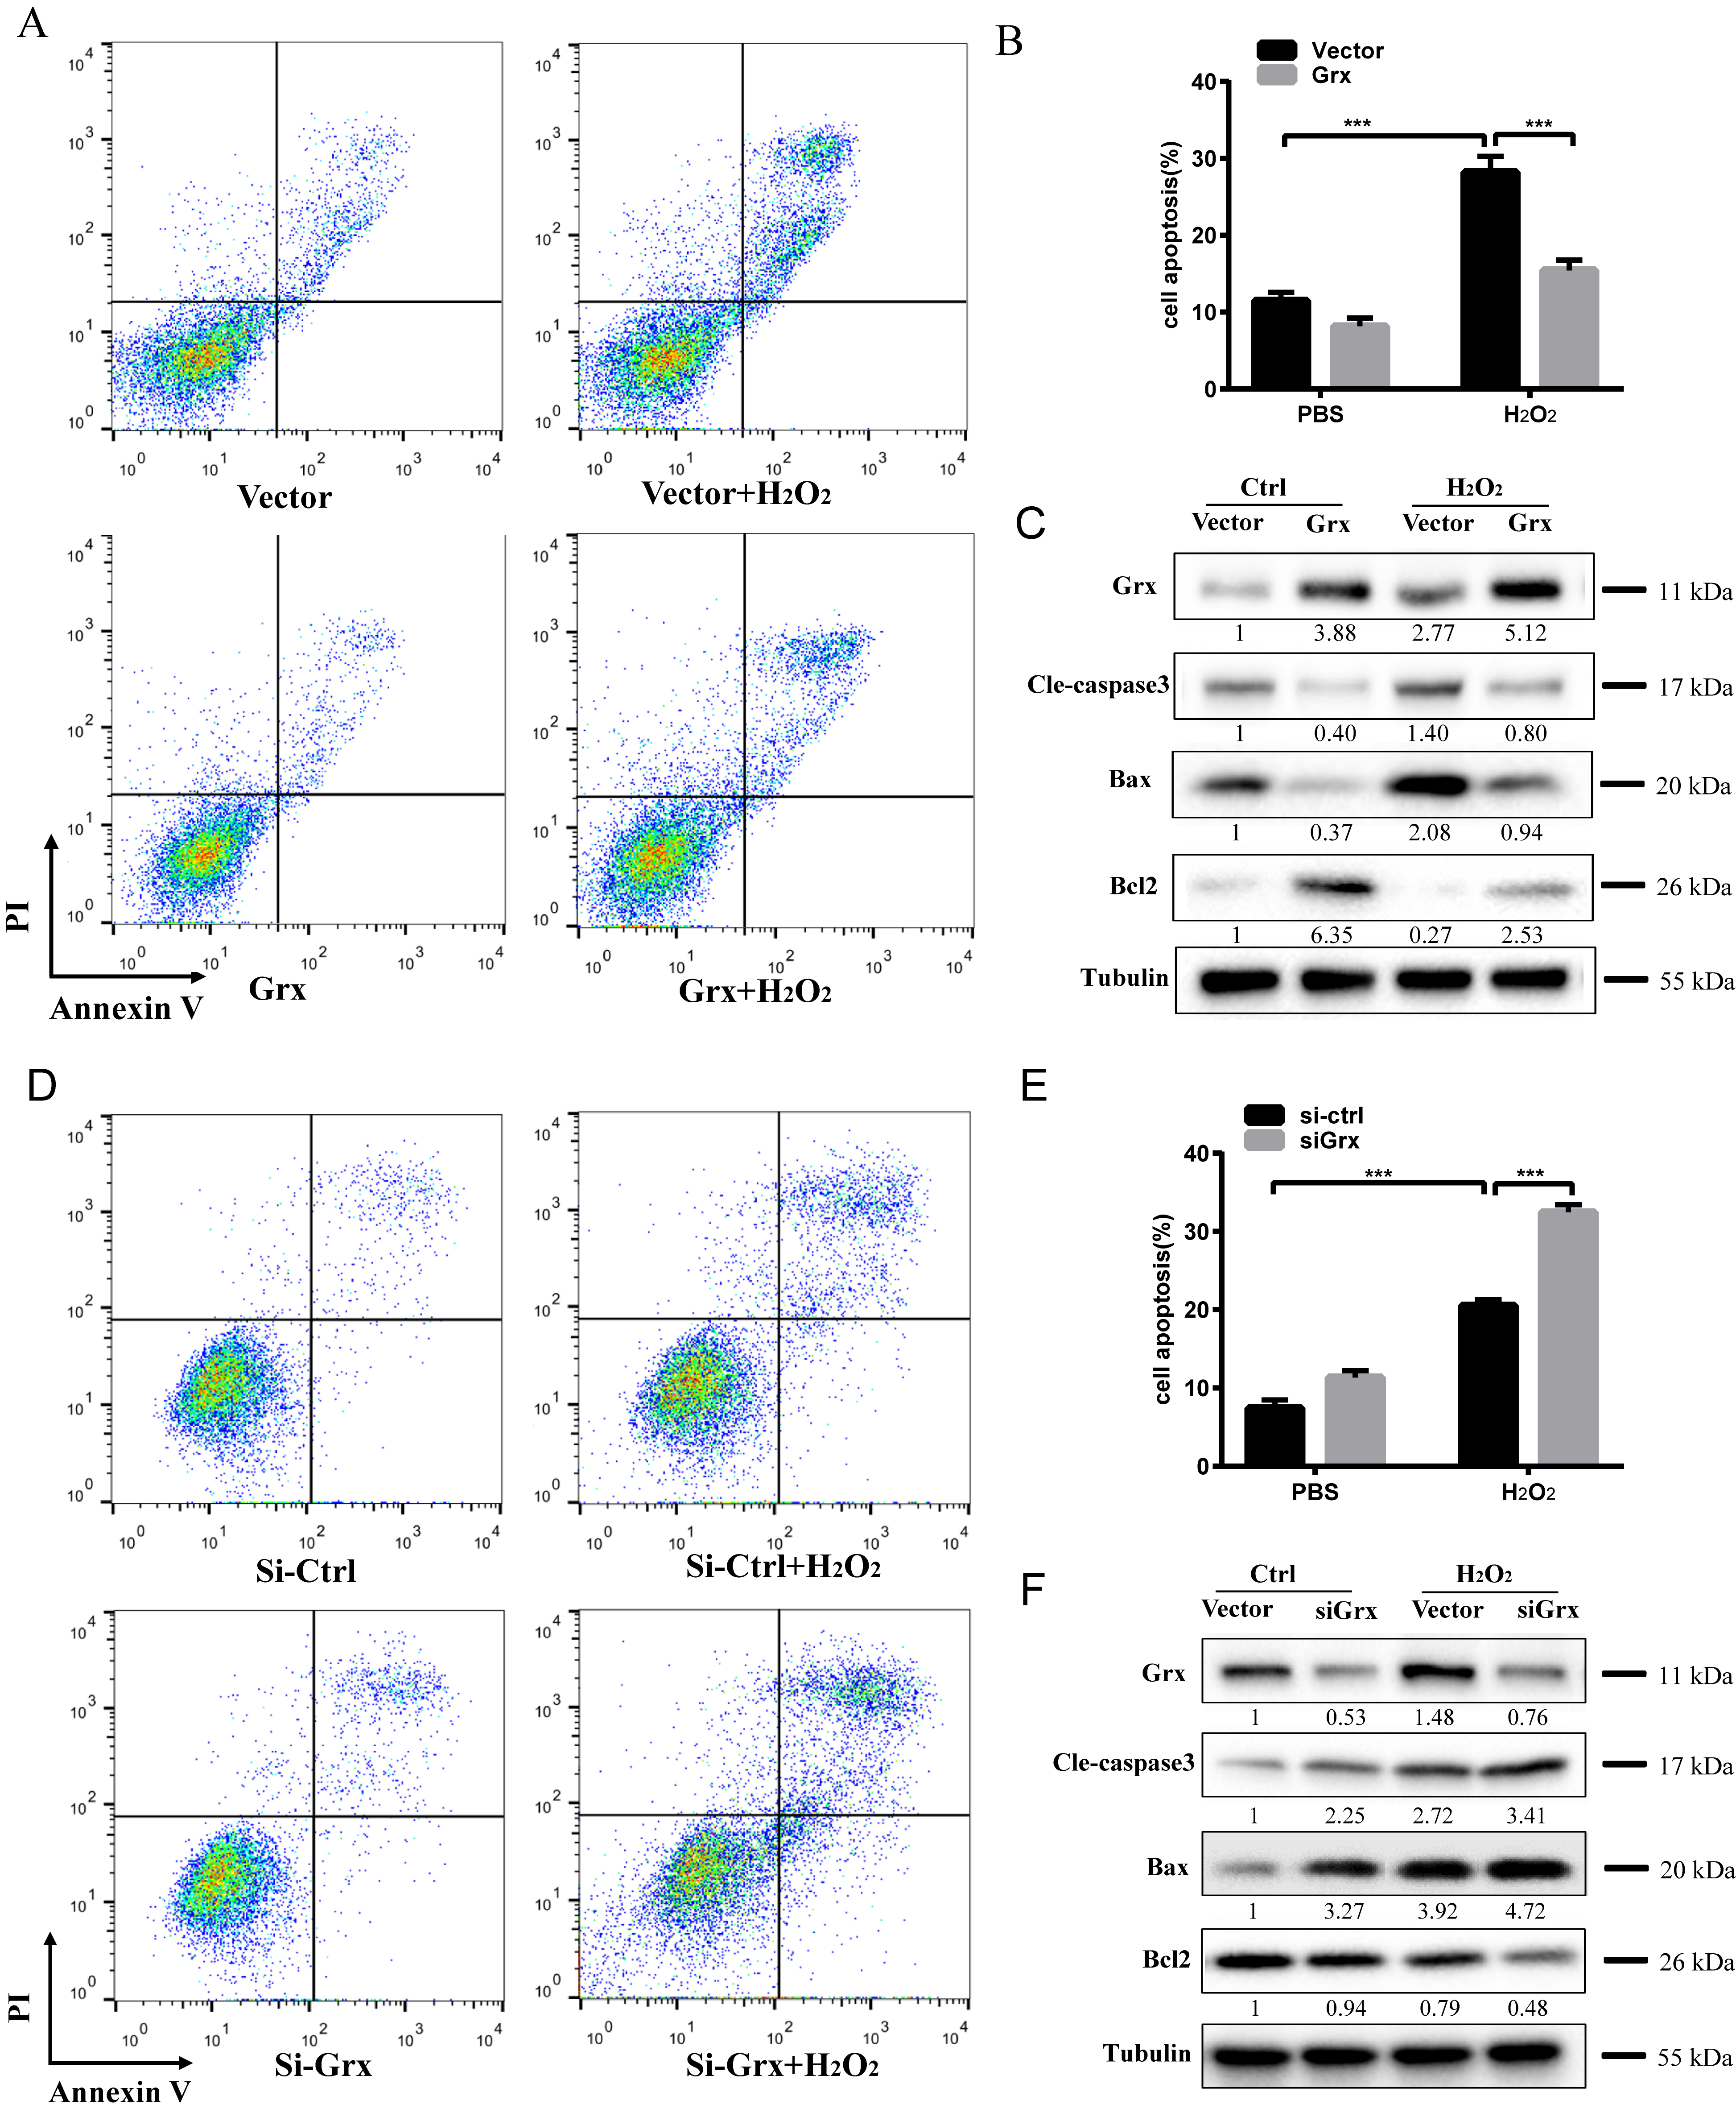
 Figure 4 of
Fan, Mol Vis 2022; 28:70-82.
Figure 4 of
Fan, Mol Vis 2022; 28:70-82.