Figure 3. Effect of Grx on cell proliferation. A: Detection of Grx expression in Grx overexpression and knockdown transfections. The quantitative statistical results of the
western blot band intensity are labeled under the corresponding western blot band. B: Levels of oxidized glutathione disulfide (GSSG) in HLE cells after treatment with 200 μM H2O2 for 24 h in the Grx overexpression or knockdown groups. C: Time course of HLE cell growth following treatment with 200 μM H2O2 for various durations in the Grx overexpression or knockdown group; D: Photograph and number of formatted clones of HLE cells following treatment with 200 μM H2O2 for 24 h in the Grx overexpression group. E: Photograph and number of formatted clones of HLE cells following treatment with 200 μM H2O2 for 24 h in the Grx knockdown group. The cell number was measured using an automated cell counter. *** p < 0.001 and * p < 0.05.
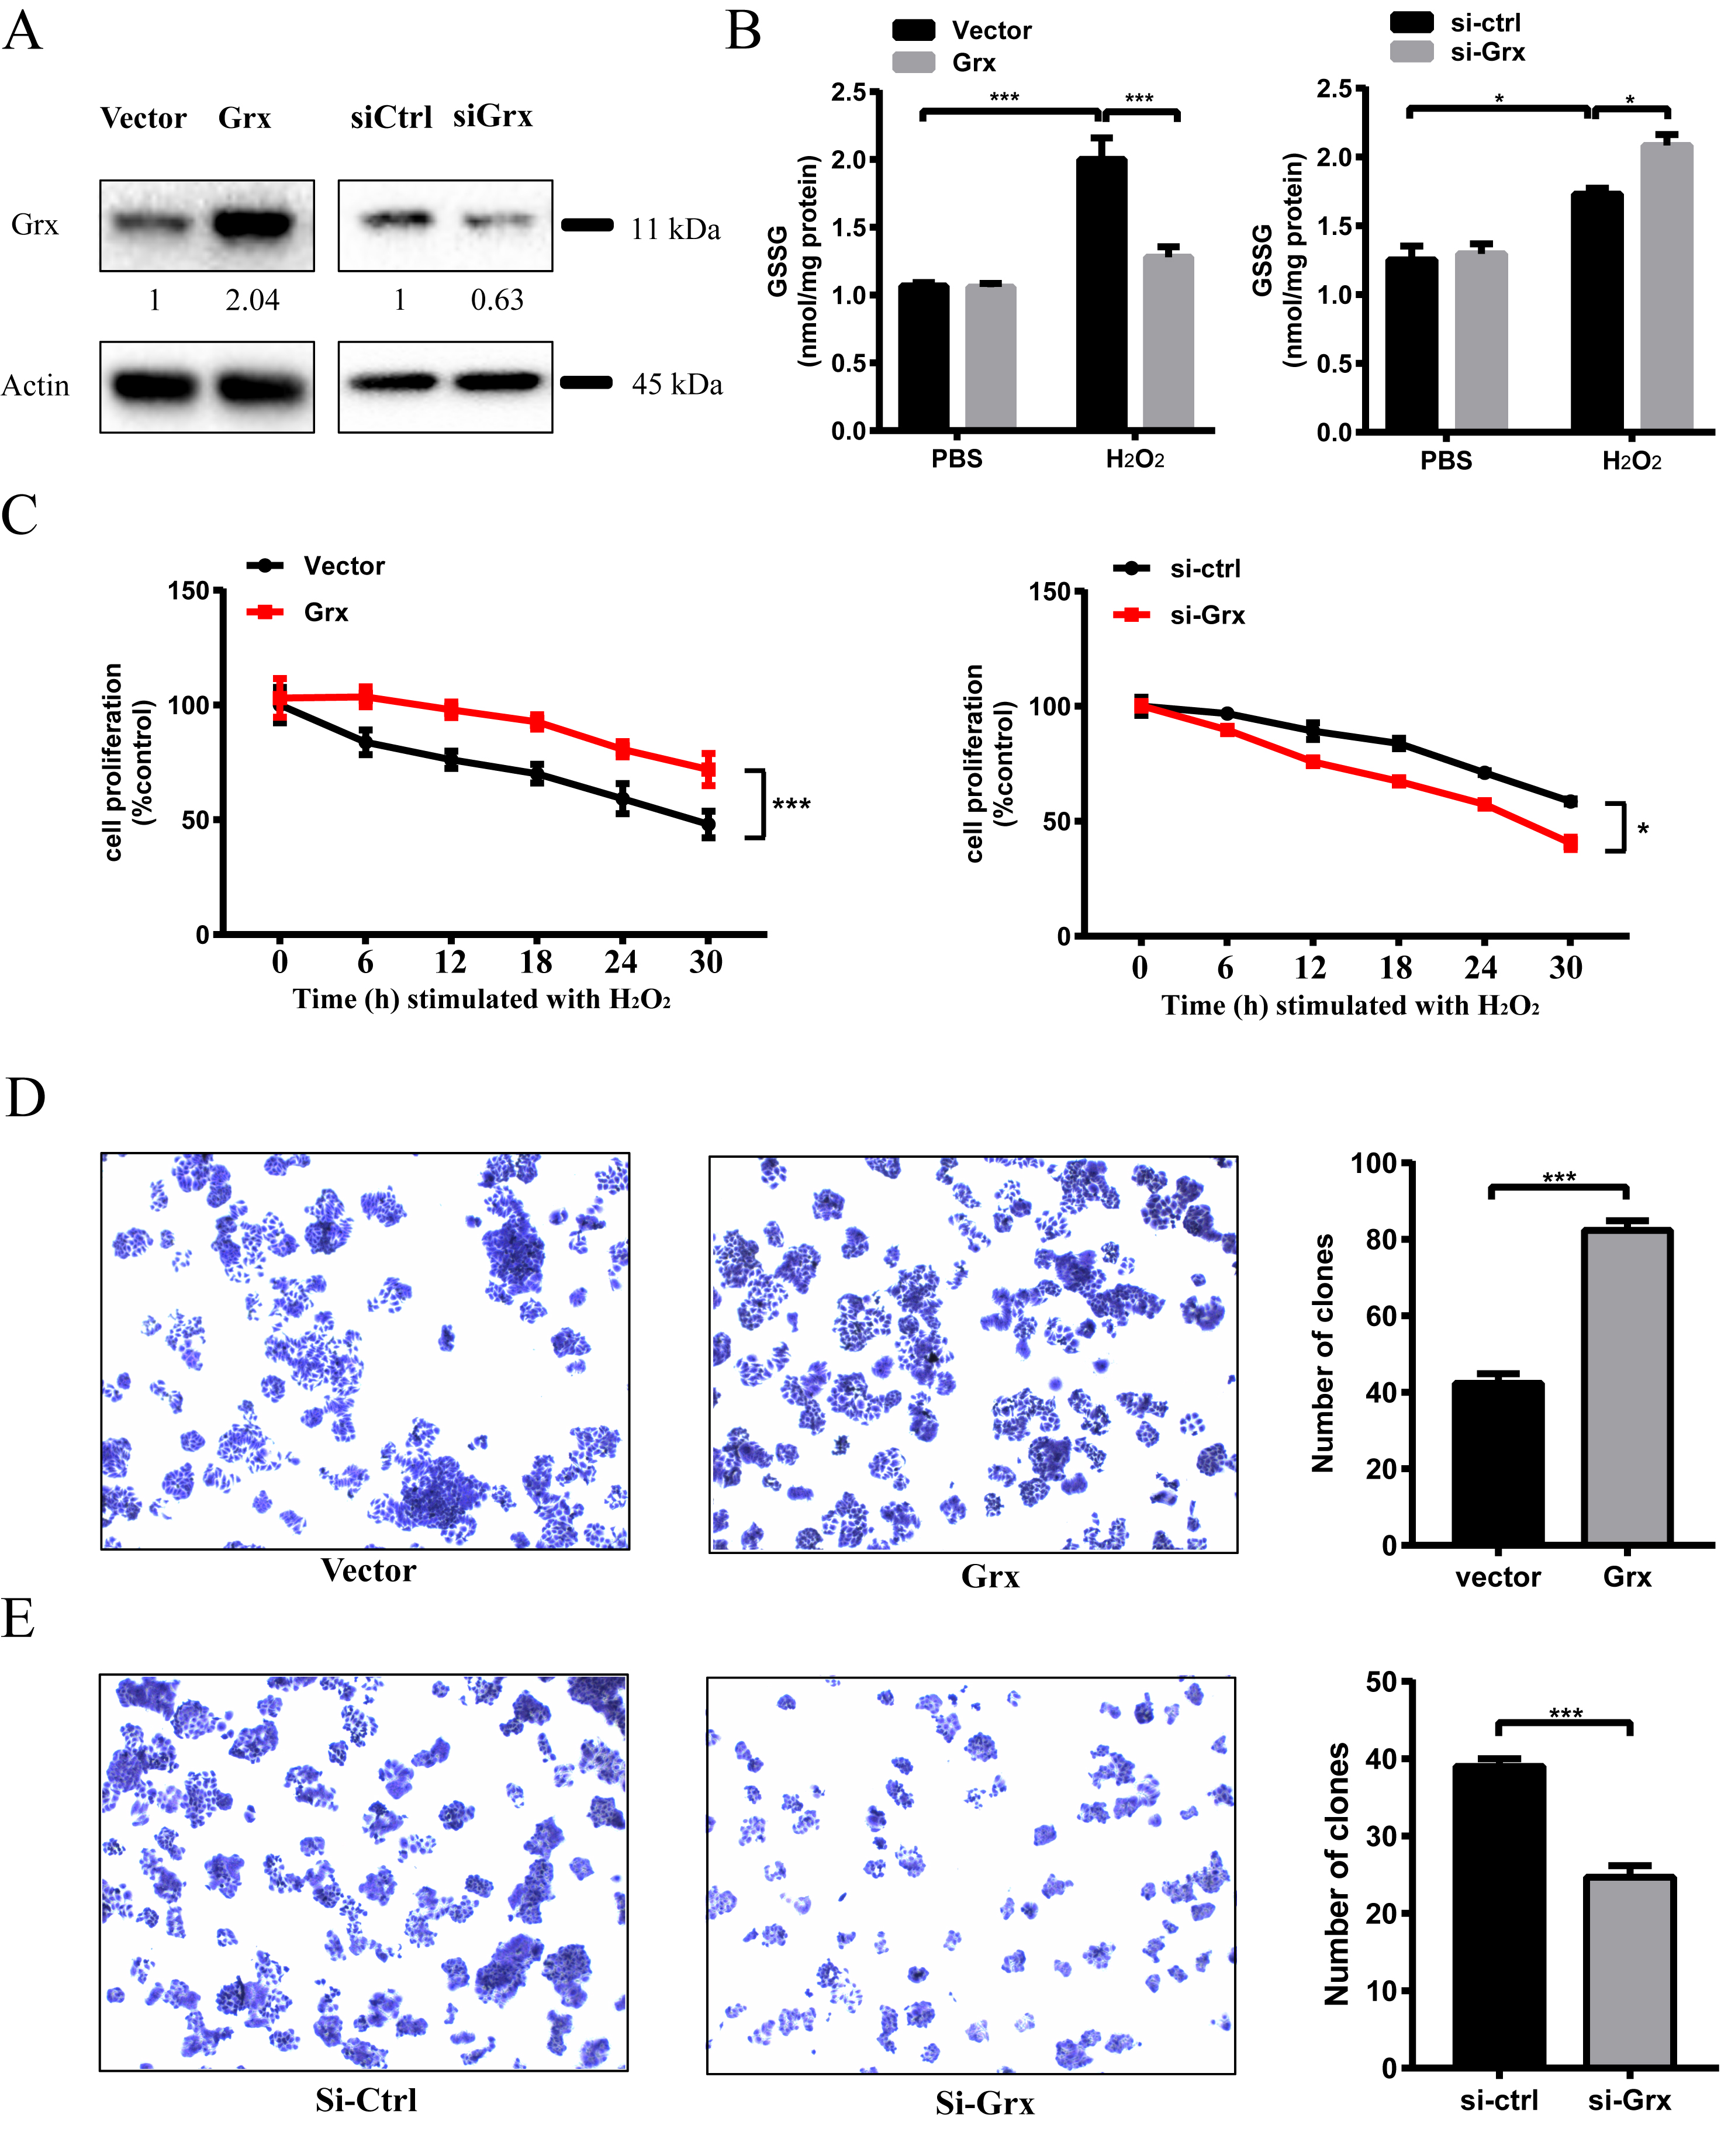
 Figure 3 of
Fan, Mol Vis 2022; 28:70-82.
Figure 3 of
Fan, Mol Vis 2022; 28:70-82.