Figure 2. Effects of Grx on the cell cycle. A: DNA content profile denoting the cell cycle distribution of HLE cells following treatment with or without 200 μM H2O2 for 24 h after Grx overexpression. B: DNA content profile denoting the cell cycle distribution of HLE cells following treatment with or without 200 μM H2O2 for 24 h after Grx knockdown. C: The percentage of HLE cells in the G1/G2/S phase following treatment with 200 μM H2O2 for 24 h after Grx overexpression. D: The percentage of HLE cells in the G1/G2/S phase following treatment with 200 μM H2O2 for 24 h after Grx knockdown. *** p < 0.001 and * p < 0.05.
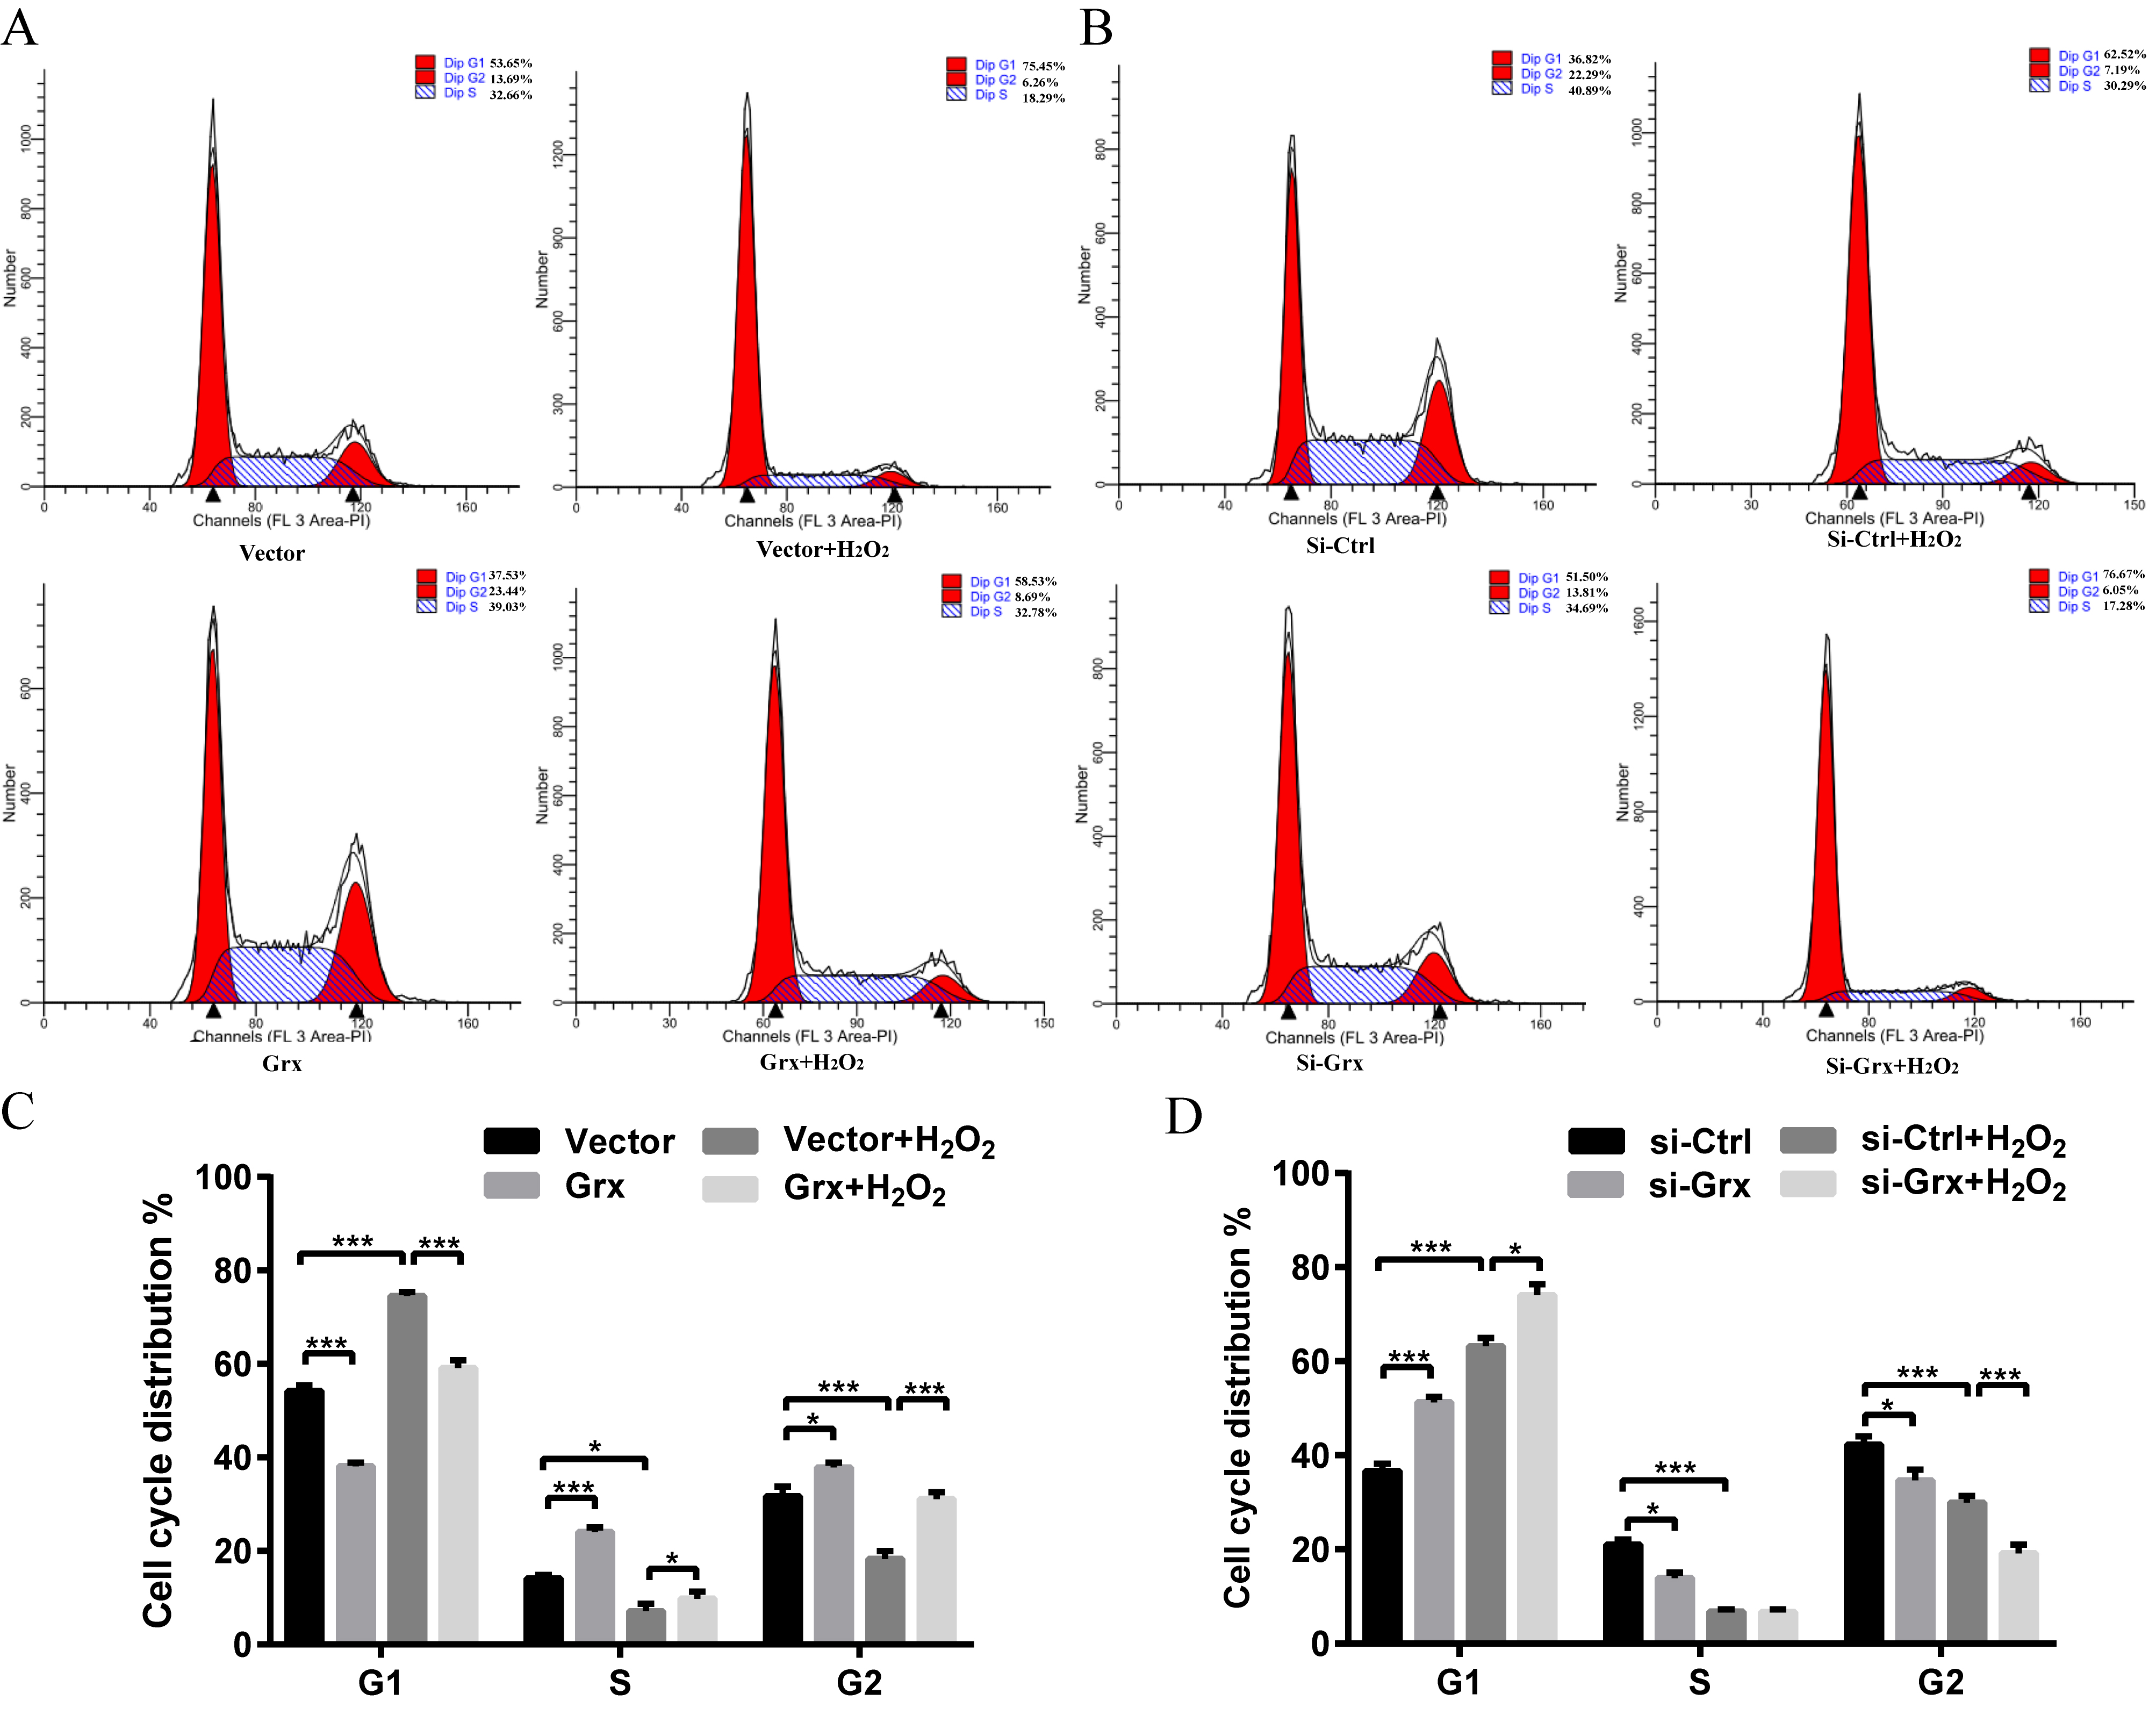
 Figure 2 of
Fan, Mol Vis 2022; 28:70-82.
Figure 2 of
Fan, Mol Vis 2022; 28:70-82.