Figure 4. Genetic analysis of family F1332. A: ExomeDepth analysis of the proband’s exome sequence data around the SIX6 locus. The ratio of the observed (patient’s exome data) to expected (seven unrelated control exomes) number of reads for
each exon is indicated by a red cross, and the gray shaded region represents this ratio within 99% confidence intervals. Note
that the majority of the ratios are around 1.0, although there is a single cross at 0.0 at the SIX6 locus, suggesting a homozygous deletion in the proband (arrow). B: AgileMultiIdeogram derived from exome sequence data of the proband showing homozygous regions (in blue) against a circular
ideogram of chromosomes 1 to 22. A 33 Mb homozygous region on chromosome 14 (56,142,480–89,338,619, GRCh37, hg19) spanning
SIX6 is shown (arrow). C: Sequence electropherogram highlights the junction of the deletion breakpoint in the proband. The deletion of 1034 bp removes
exon 1 of SIX6 and its surrounding sequences on either side. Sequence from a normal control subject is shown for comparison. D: PCR assay and agarose gel electrophoresis of additional family members. PCR1 and PCR2 were amplified in separate reaction
mixtures, pooled in terms of patient order, and then run on the same gel. PCR1 gave a 776 bp product corresponding to a normal
wild-type allele containing exon 1, whereas PCR2 would be expected to give a 405 bp product when the exon 1 deletion mutant
allele was present. Note that the proband (IV:3) only gave a product of 405 bp for PCR2, confirming homozygosity for the deletion,
whereas the parents (III:2 & III:3) gave products of 776 bp for PCR1 and 405 bp for PCR2, indicating their carrier status.
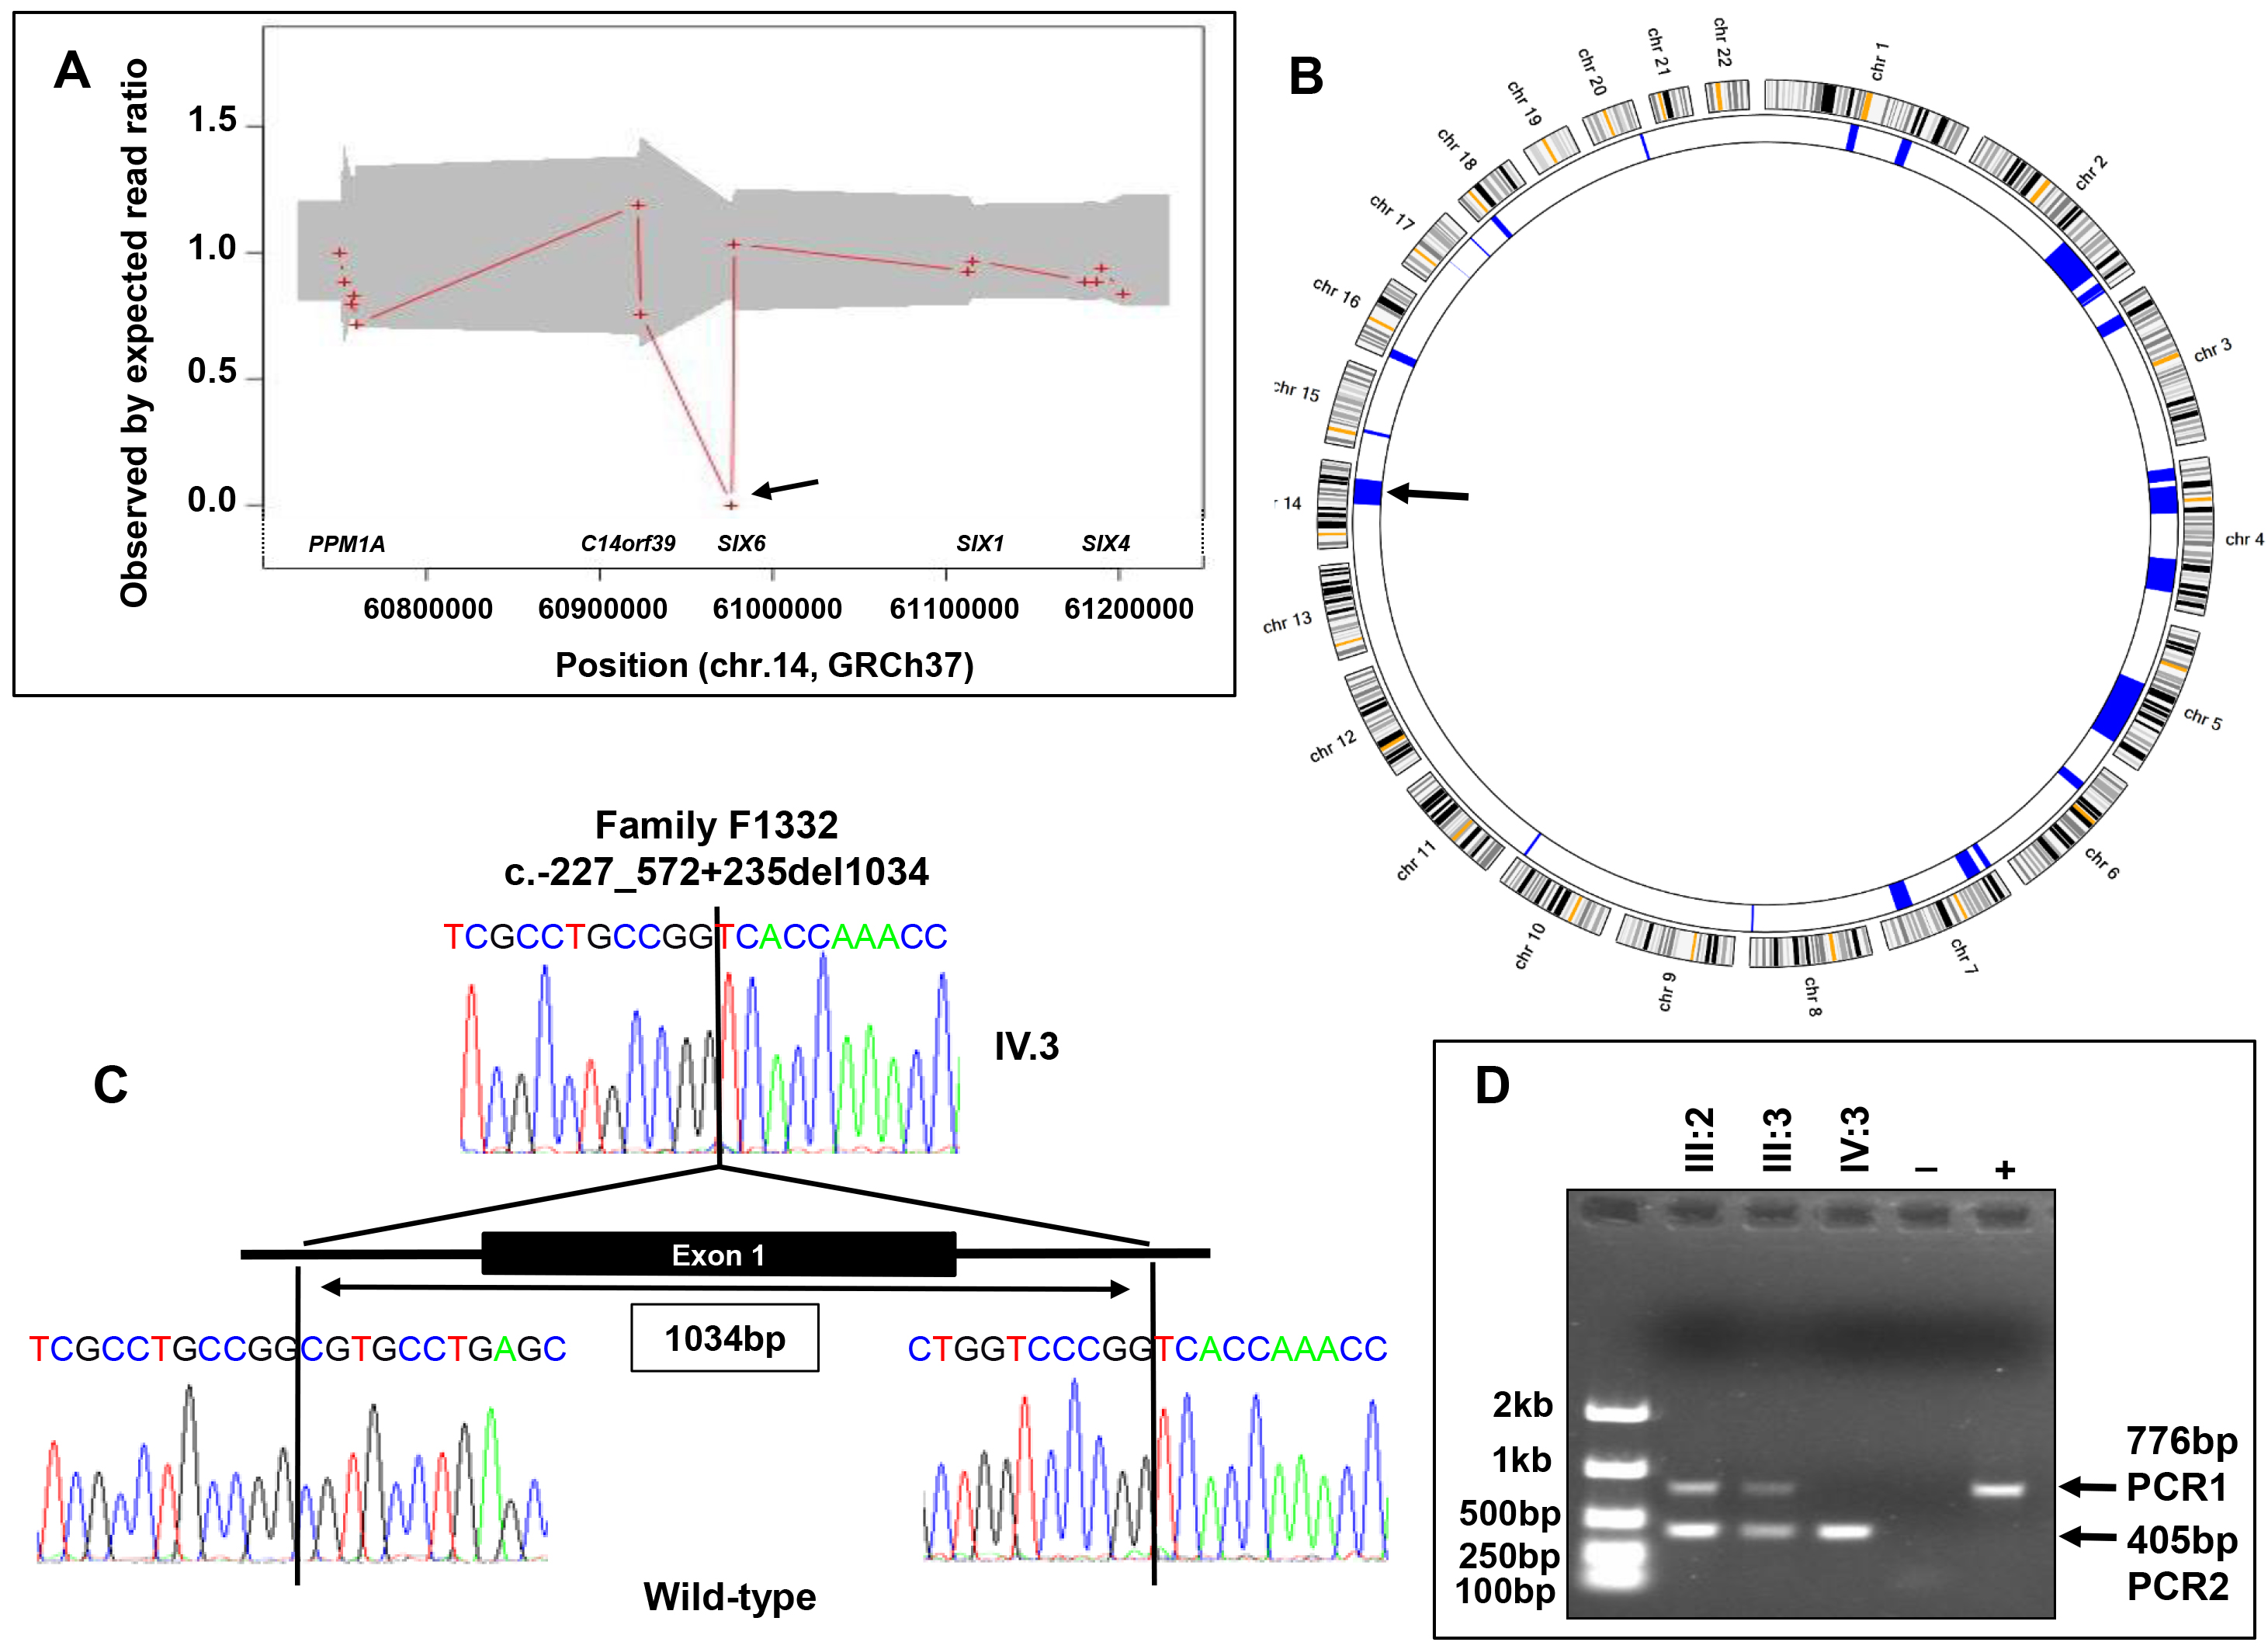
 Figure 4 of
Panagiotou, Mol Vis 2022; 28:57-69.
Figure 4 of
Panagiotou, Mol Vis 2022; 28:57-69.