Figure 2 of
Lauwen, Mol Vis 2022; 28:536-543.
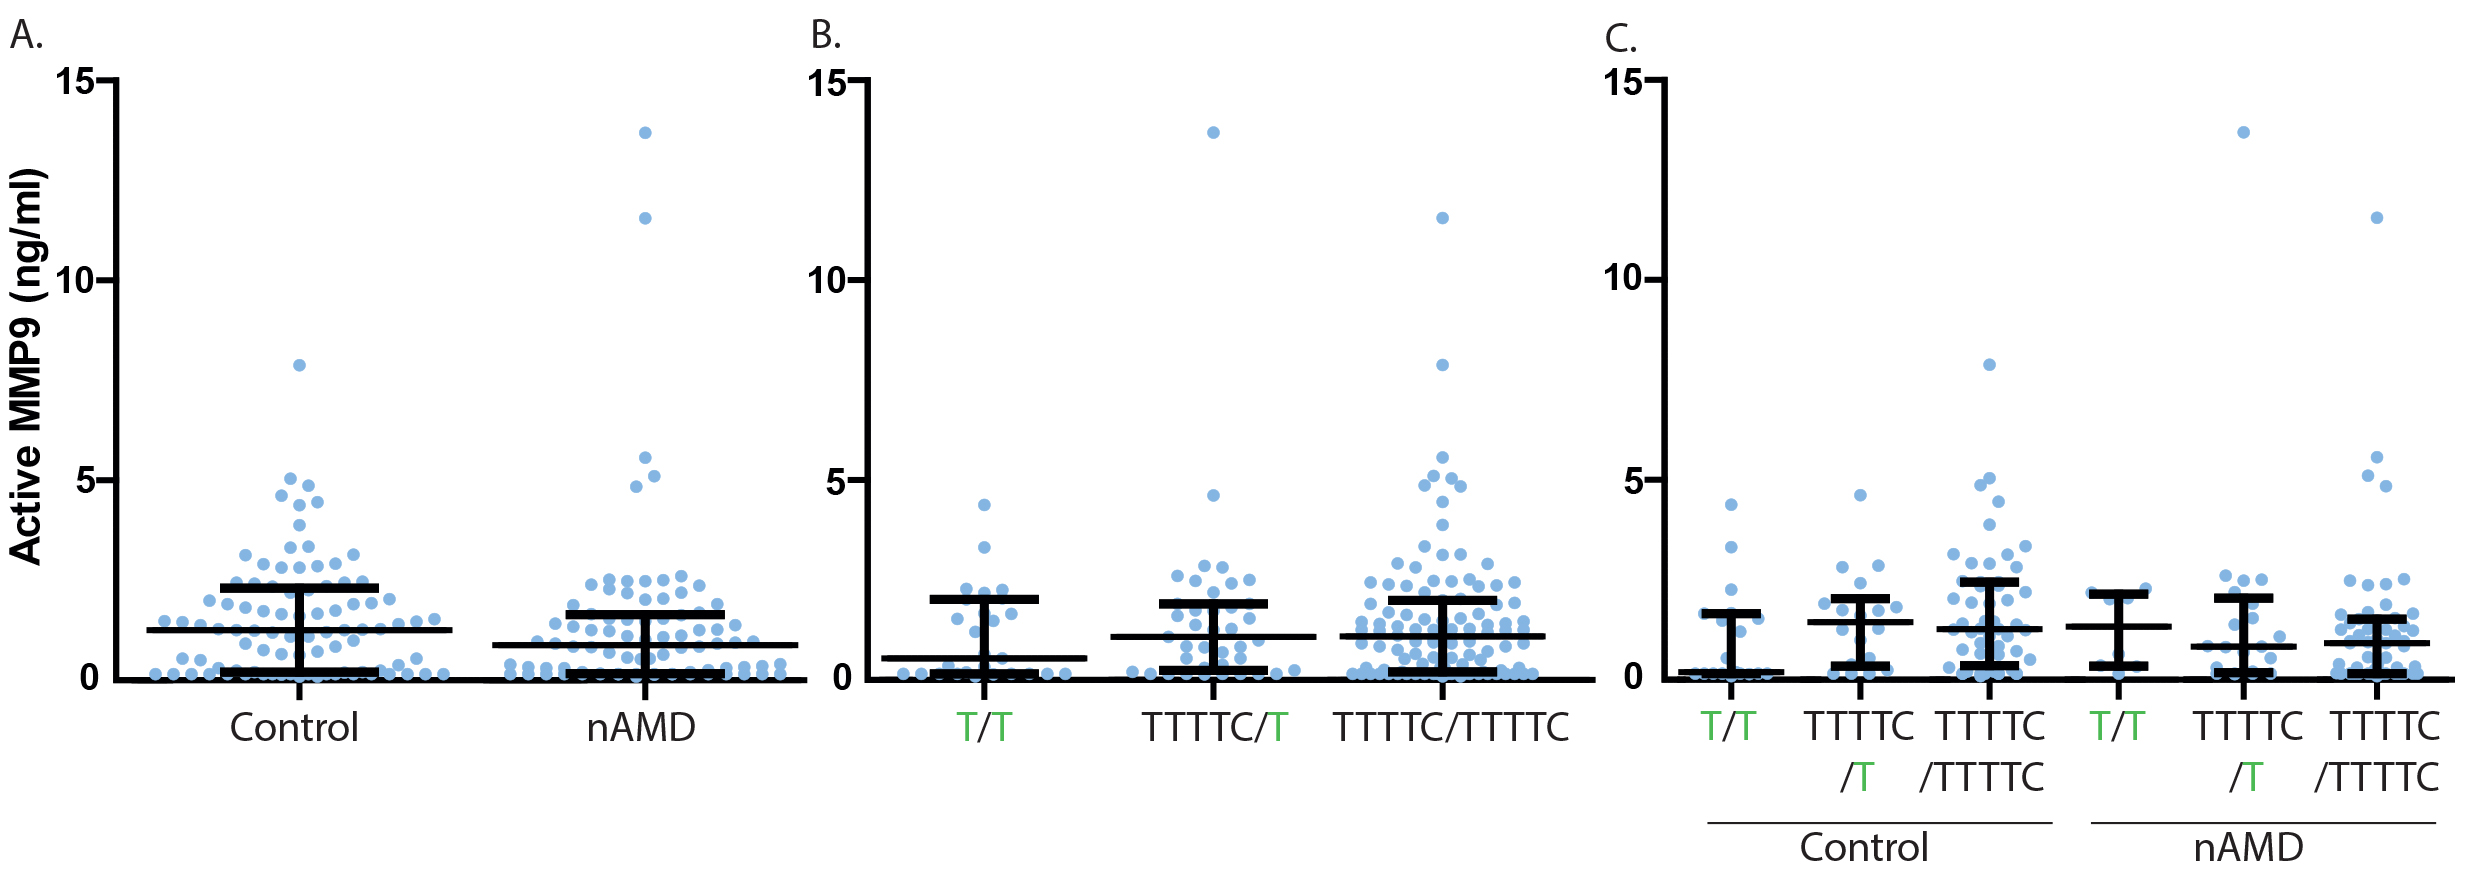
Figure 2.
Hemopexin (HPX) levels of the controls compared with those of the patients with age-related macular degeneration. Bars represent median values, and whiskers represent interquartile ranges.
 Figure 2 of
Lauwen, Mol Vis 2022; 28:536-543.
Figure 2 of
Lauwen, Mol Vis 2022; 28:536-543.