Figure 6. Cell viability in the presence of various SPS concentrations. (A) HCE-T and (B) Vero cells were exposed to SPS for 24 or 48
h, and cell viability was determined using the CCK-8 colorimetric assay. All results are presented as a percentage of the
control group (0 μg/ml SPS). Data are presented as means ± standard deviations (n = 6).
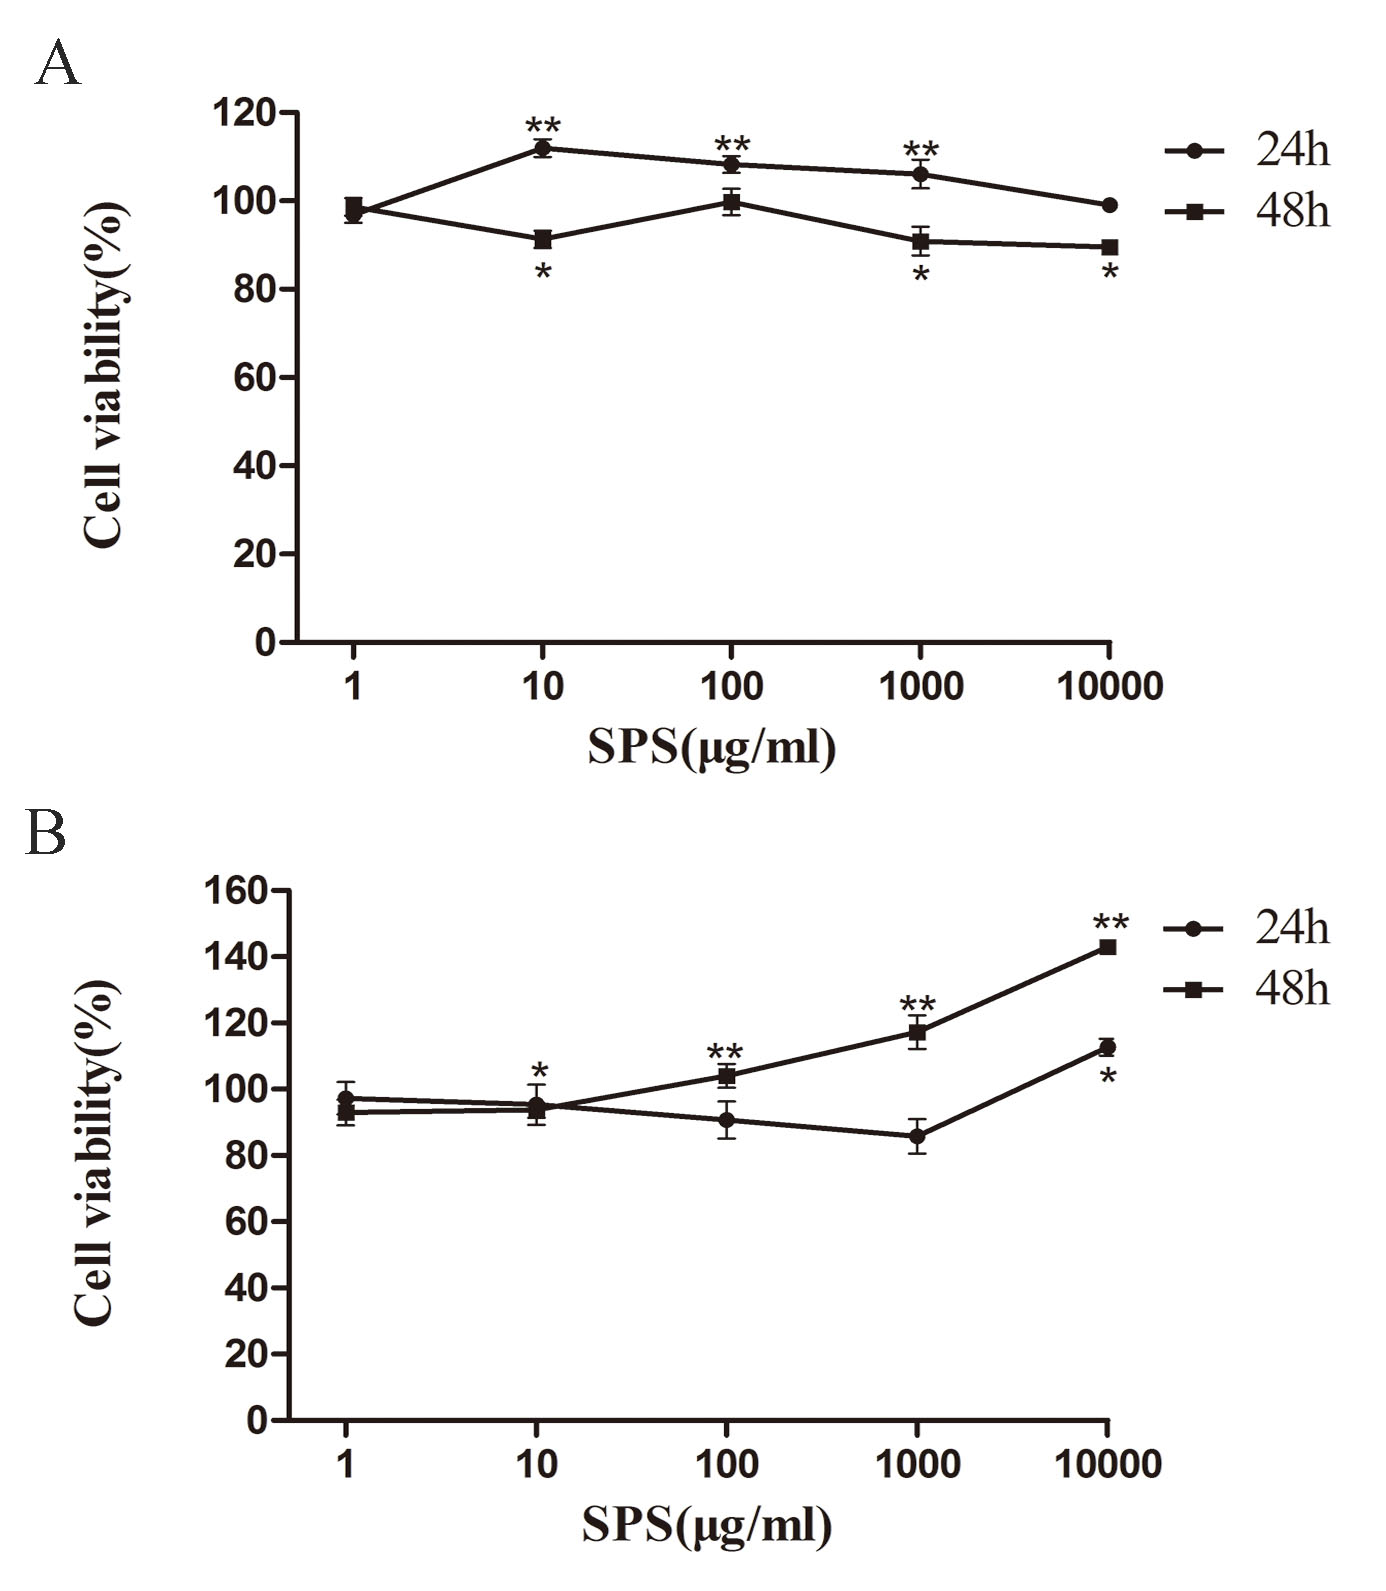
 Figure 6 of
Li, Mol Vis 2022; 28:516-525.
Figure 6 of
Li, Mol Vis 2022; 28:516-525.