Figure 4. SPS decreased the expression of the ICP4 protein and VP16 mRNA. (A) HCE-T cells were preincubated with various concentrations
of SPS followed by infection with HSV-1f, and ICP4 and β-actin levels were then measured using western blotting. (B) Average
gray value intensities of western blot bands were measured using ImageJ software. Uninfected cells were set as a mock group,
and infected cells without SPS preincubation were set as the control group. The intensity of the control group was assigned
a value of 1 (n = 3). **p < .01. (C) The VP16/GAPDH ratio in cells treated with different concentrations of SPS was determined by RT–PCR. Data are
presented as means ± standard deviations (n = 3). **p < .01 compared with the control group.
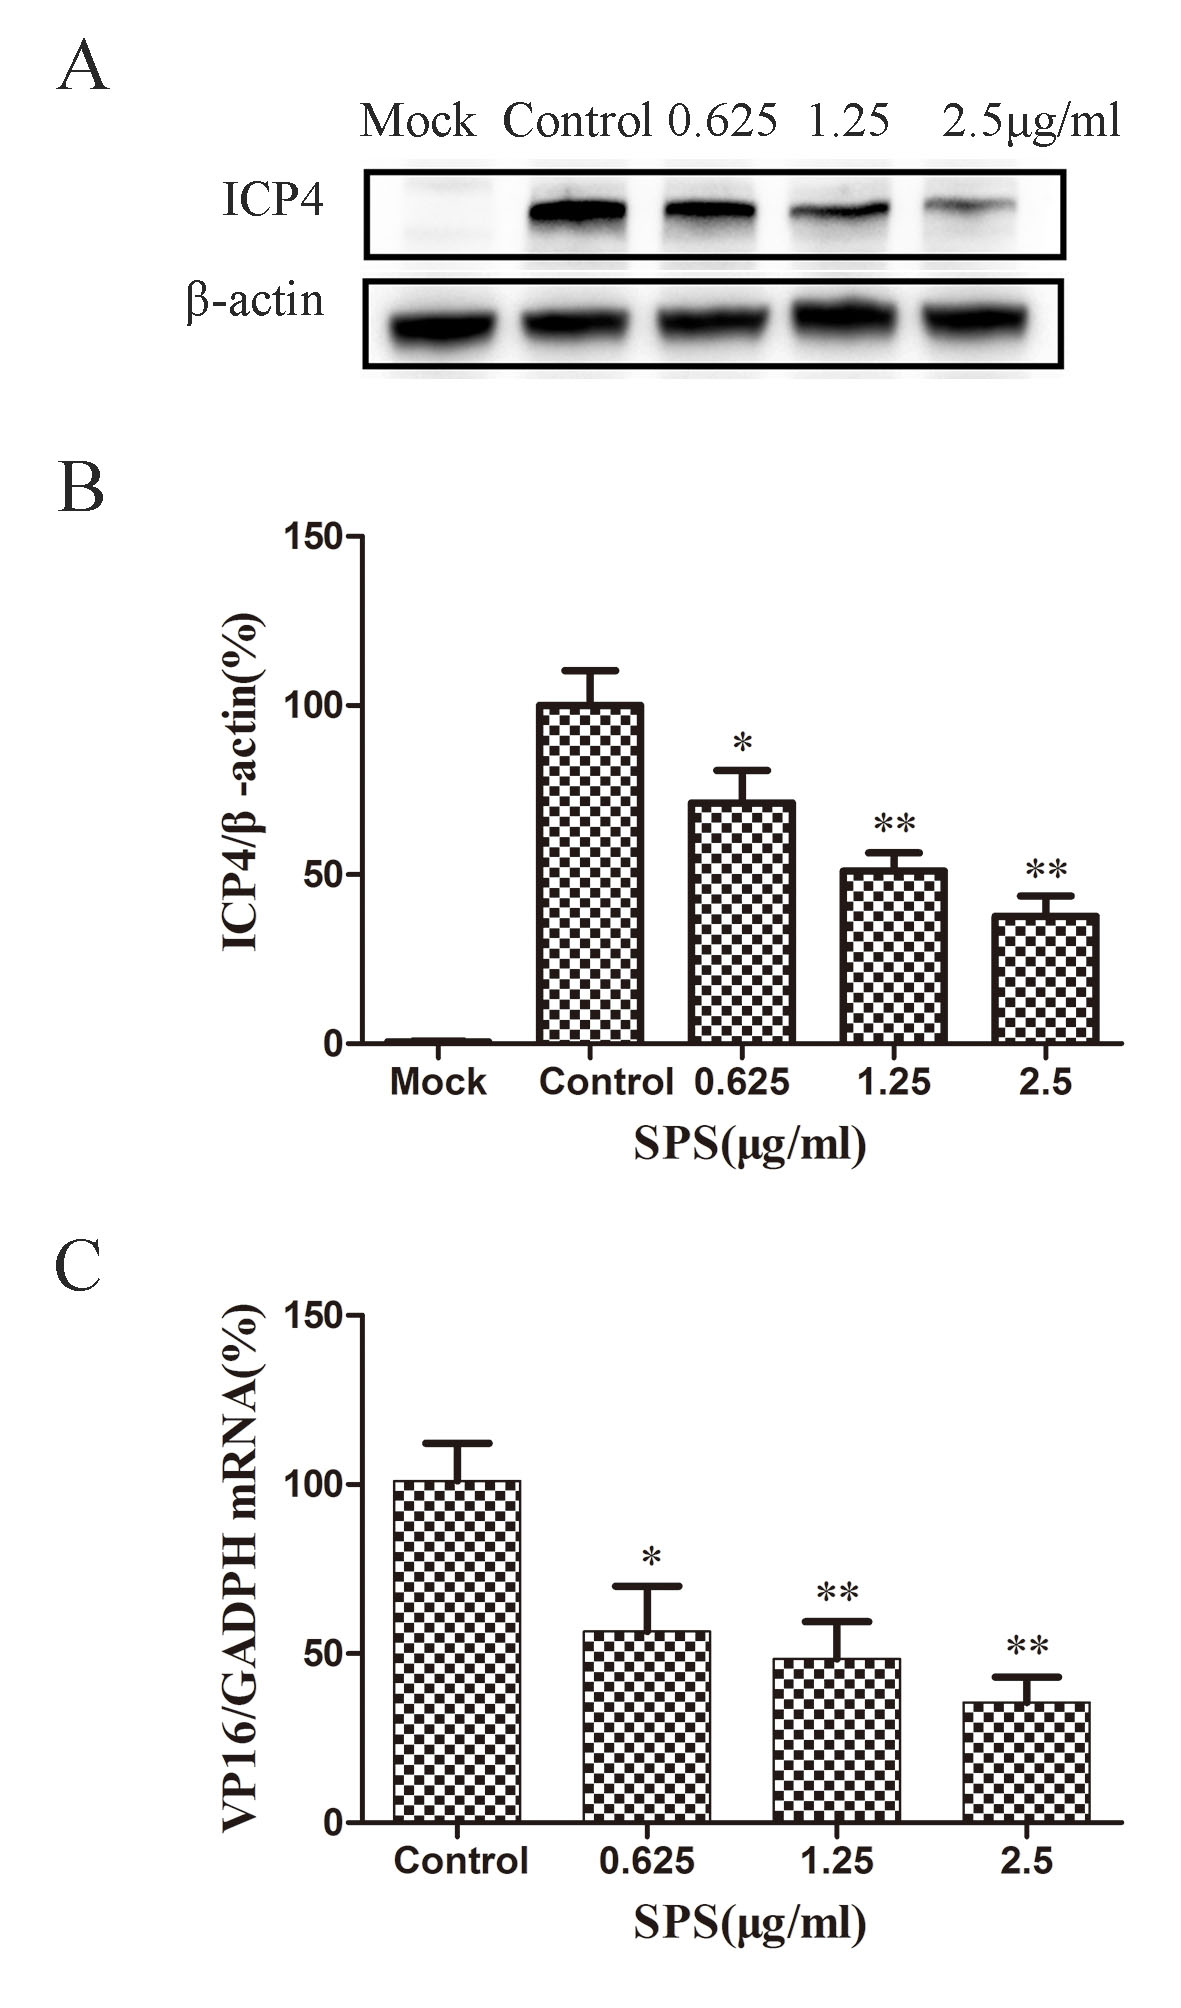
 Figure 4 of
Li, Mol Vis 2022; 28:516-525.
Figure 4 of
Li, Mol Vis 2022; 28:516-525.