Figure 1. The inhibitory effect of SPS on HSV-1 in HCE-T and Vero cells. HCE-T (A, C) and Vero (B, D) cells were incubated with HSV-1g
for 1 h at 37°C and then cultured with different concentrations of SPS for 24 h. The control groups included cells treated
without SPS. Phase contrast photos (A2, B2) show the same fields of cells as fluorescent photos (A1, B1). GFP fluorescence
in A and B was quantified using ImageJ software (C, D). The average intensity of the control cells was assigned a value of
100. Viral plaque assay (E) was conducted in HCE-T cells. The cells were incubated with HSV-1f for 1 h at 37°C and then exposed
to SPS for 48 h. Mock groups refer to uninfected cells treated without SPS. The percentages of PFU from E were calculated
(F; versus the control group). Data are presented as the means ± standard deviations (n = 3). *p < .05 and **p < .01 (compared with the control group).
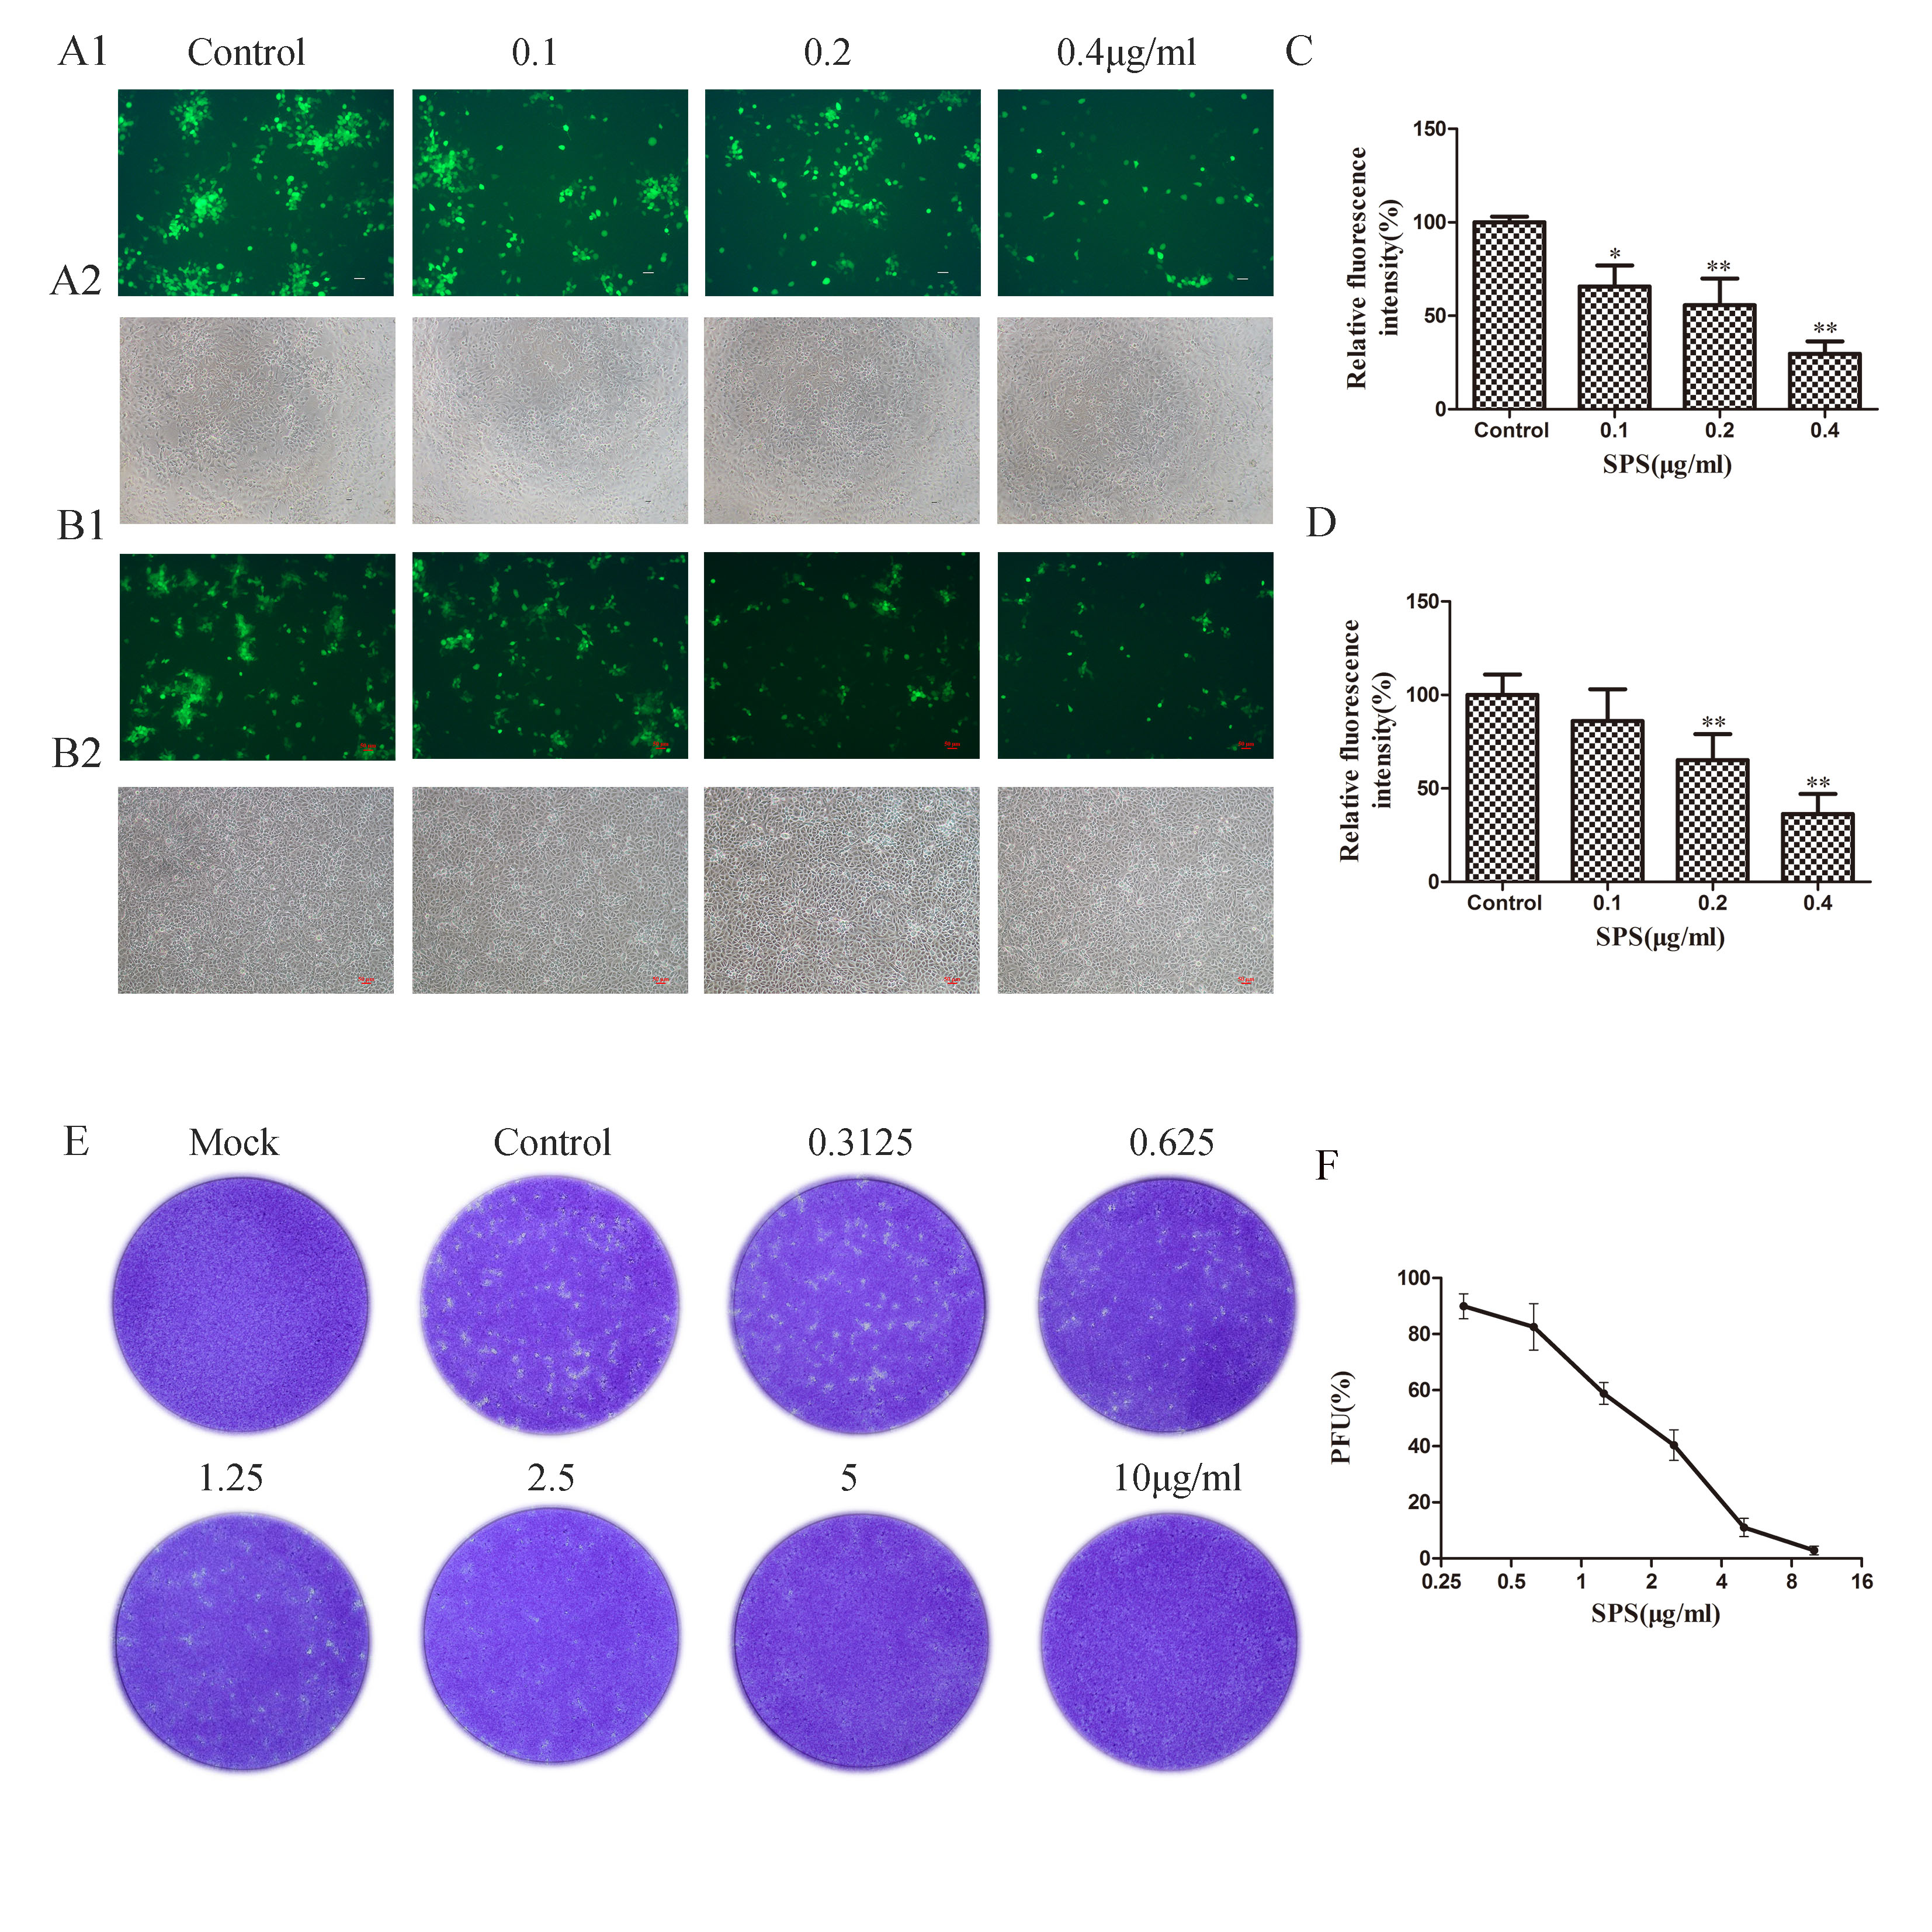
 Figure 1 of
Li, Mol Vis 2022; 28:516-525.
Figure 1 of
Li, Mol Vis 2022; 28:516-525.