Figure 5. Heat mapping of a SD-OCT scan of a lumpfish retina. A representative 2D heat map displays the relative thickness of the whole
retina from a complete SD-OCT scan of a juvenile cultured lumpfish (100 dph; A). The heat map includes the specific specimen identifier, the number of B-scans processed, and a color scale representing
relative thickness (in micrometers). The blue area on the top right of panel (A) depicts the general position of the optic nerve area. Panel C shows an overlay of the heat map with the volume intensity
projection (en face image) (B) upon the SD-OCT scan of the same specimen.
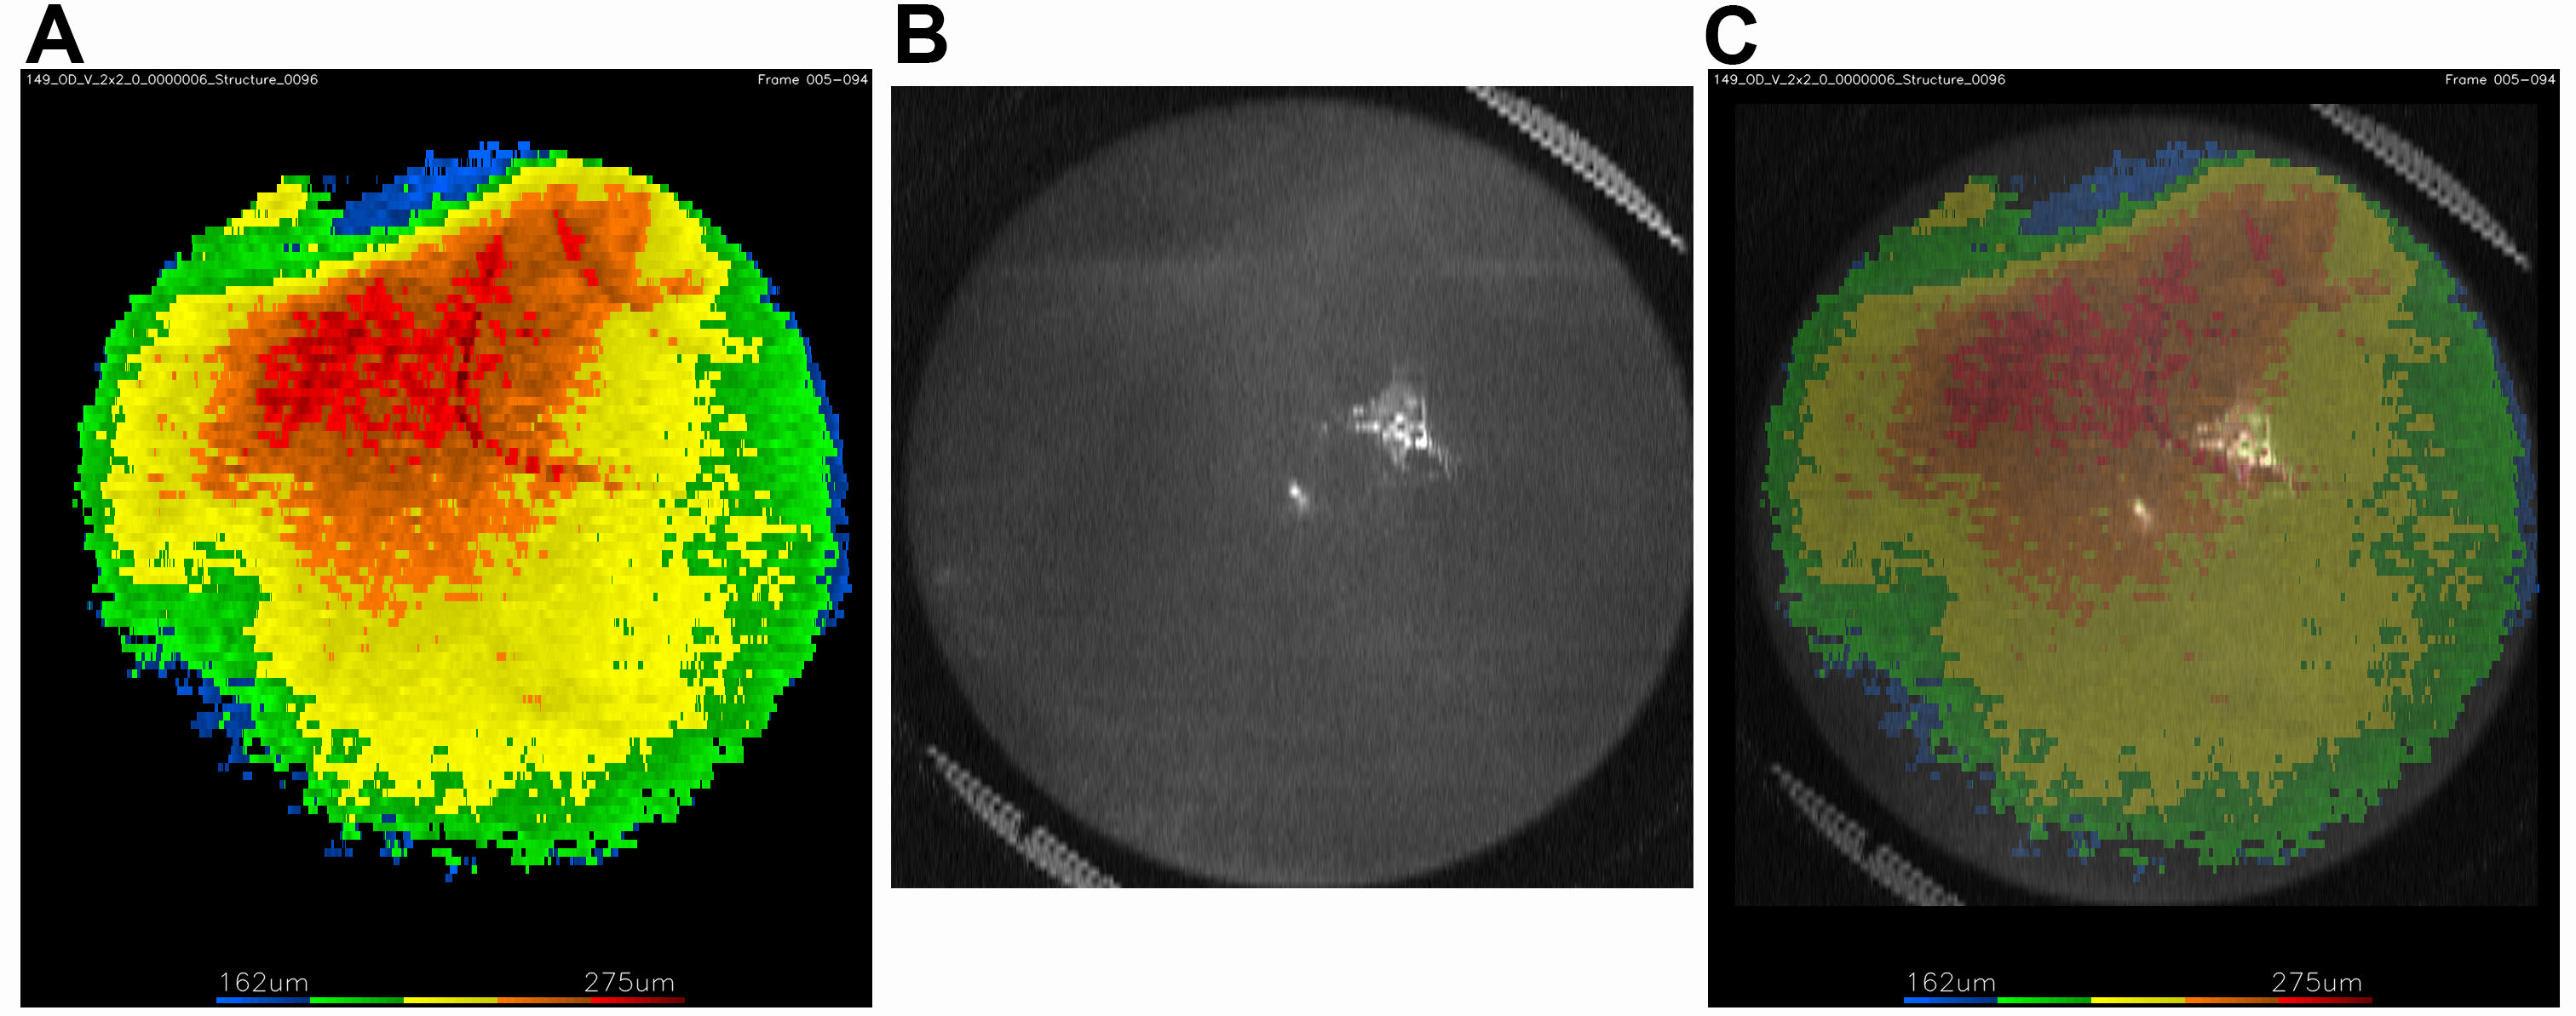
 Figure 5 of
Barter, Mol Vis 2022; 28:492-499.
Figure 5 of
Barter, Mol Vis 2022; 28:492-499.