Figure 3. Comparison between manual measurements and the algorithm’s segmentation analysis of lumpfish retinal thickness. Three B-scans
per specimen were selected, and the average retinal thickness was analyzed manually and using the algorithm. Error bars represent
the standard error of the mean. No significant differences were observed between the manual and algorithm measurements (t-test, p>0.05).
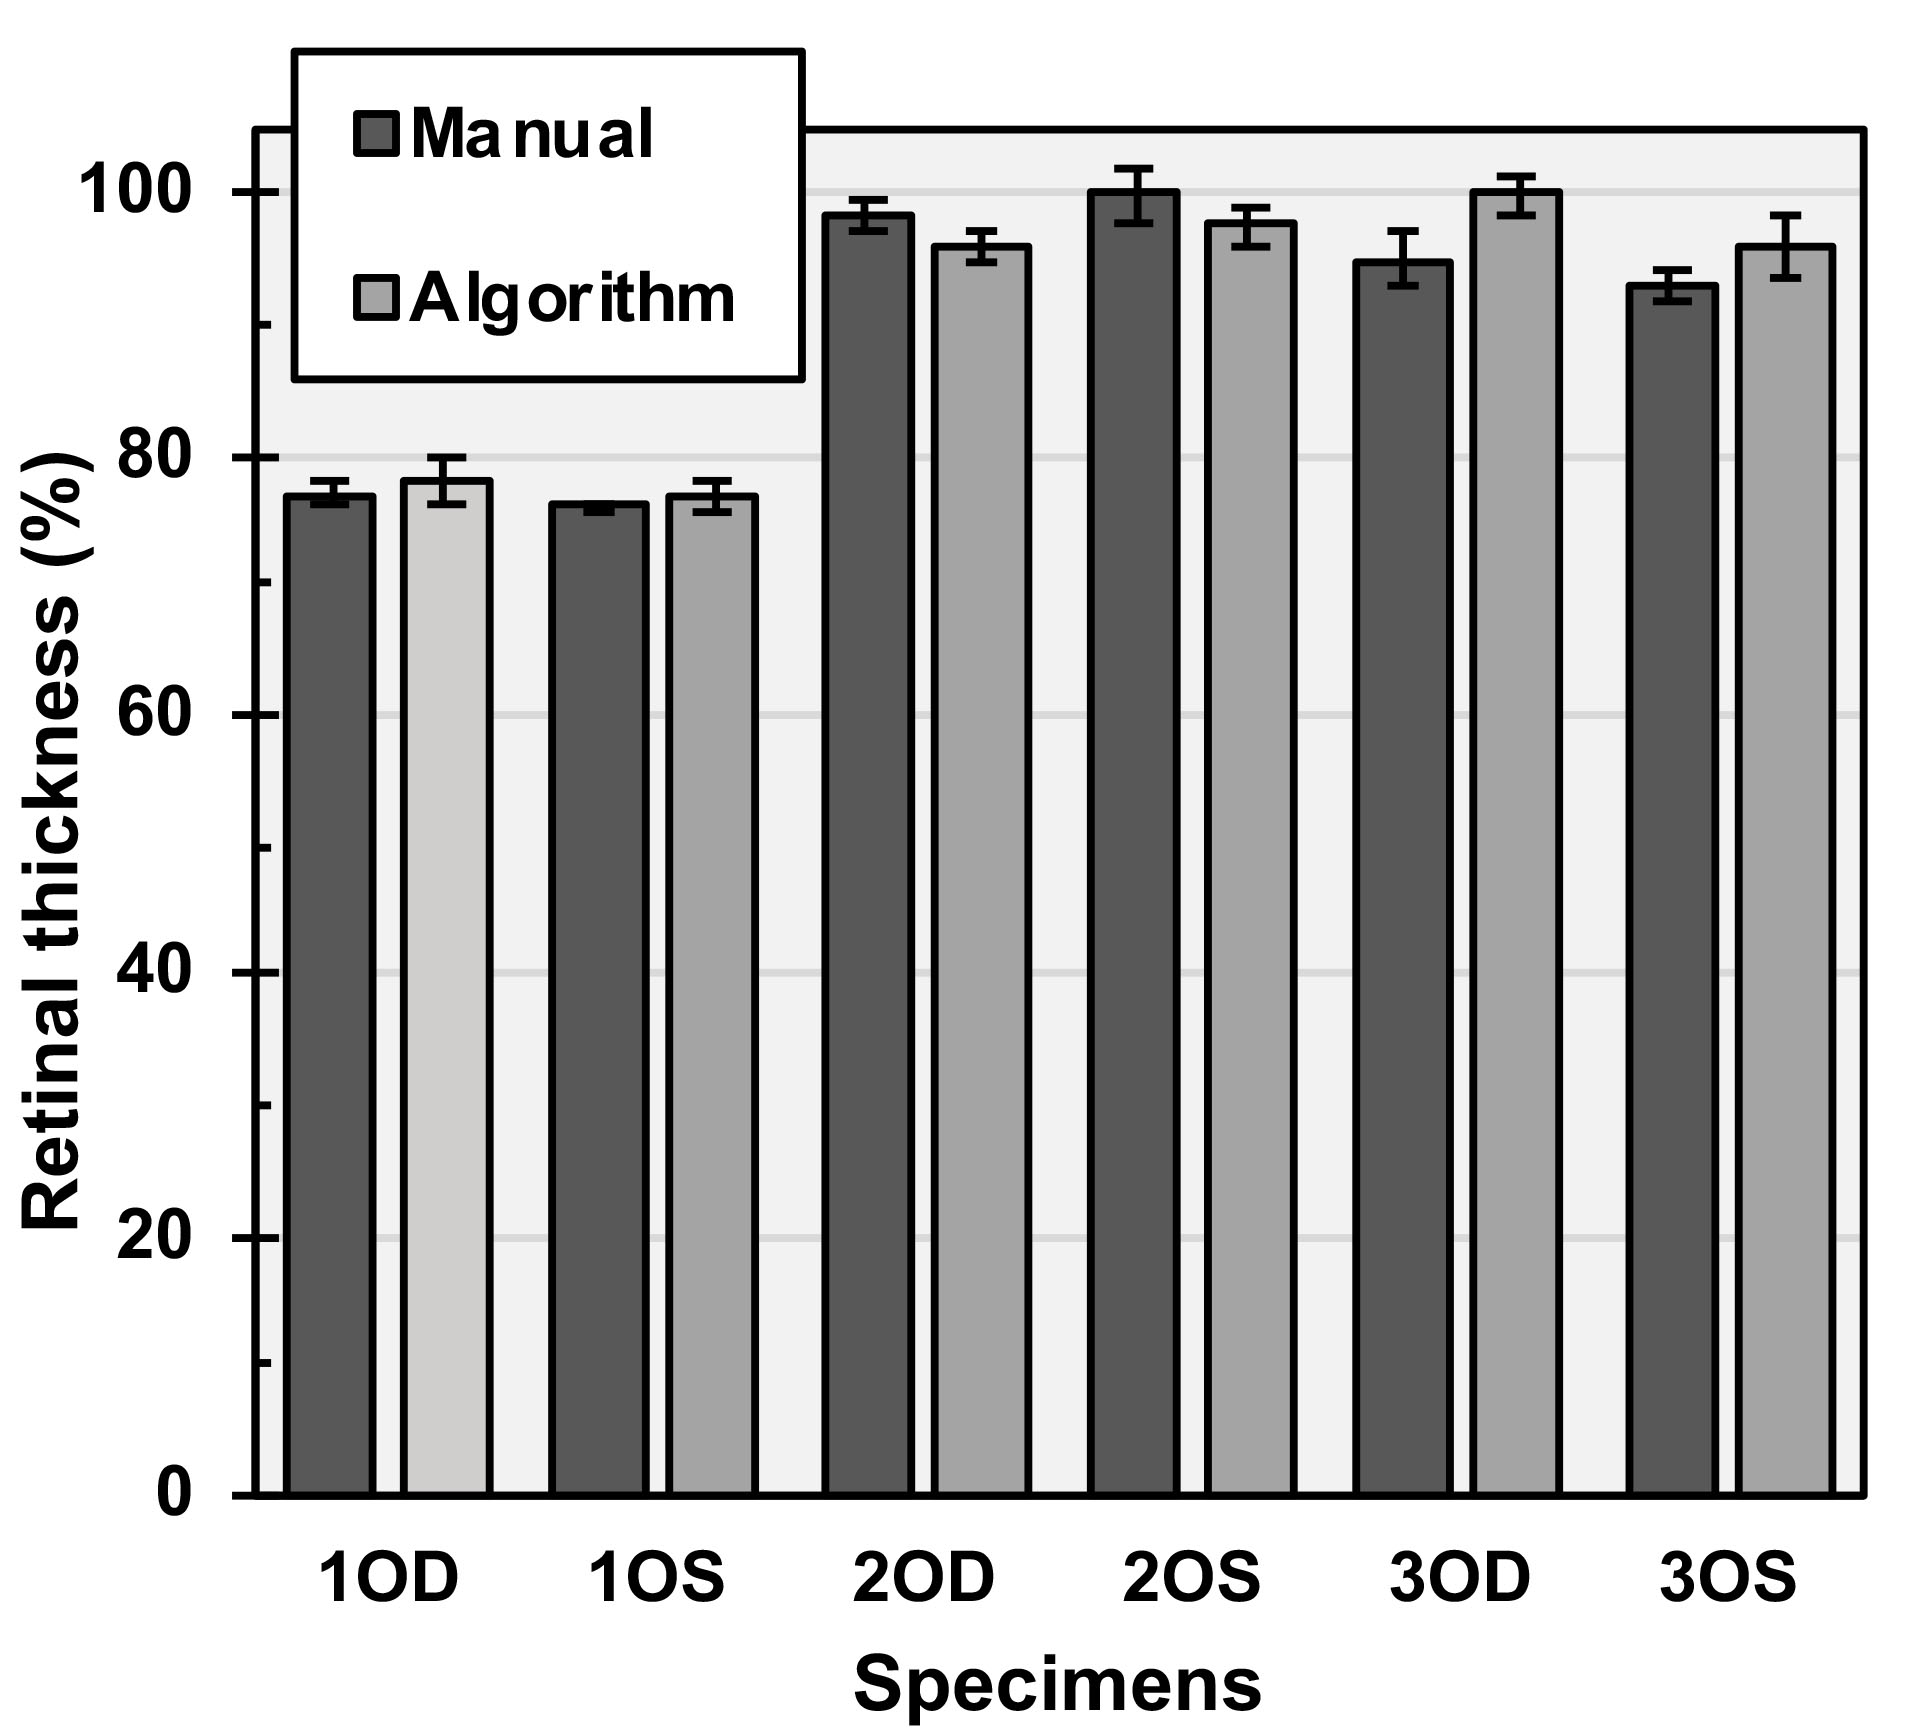
 Figure 3 of
Barter, Mol Vis 2022; 28:492-499.
Figure 3 of
Barter, Mol Vis 2022; 28:492-499.