Figure 2. Representative SD-OCT retinal B-scan analysis of a zebrafish. The original B-scan image (A) was processed and segmented using the image segmentation program (C). The segmentation of the retinal layers (B) represents the overlay of the segmented image (C) upon the original image (A). Several retinal layers are visible and labeled in (A). Actual thickness measurements in micrometers of the three segmented layers are indicated in (C).
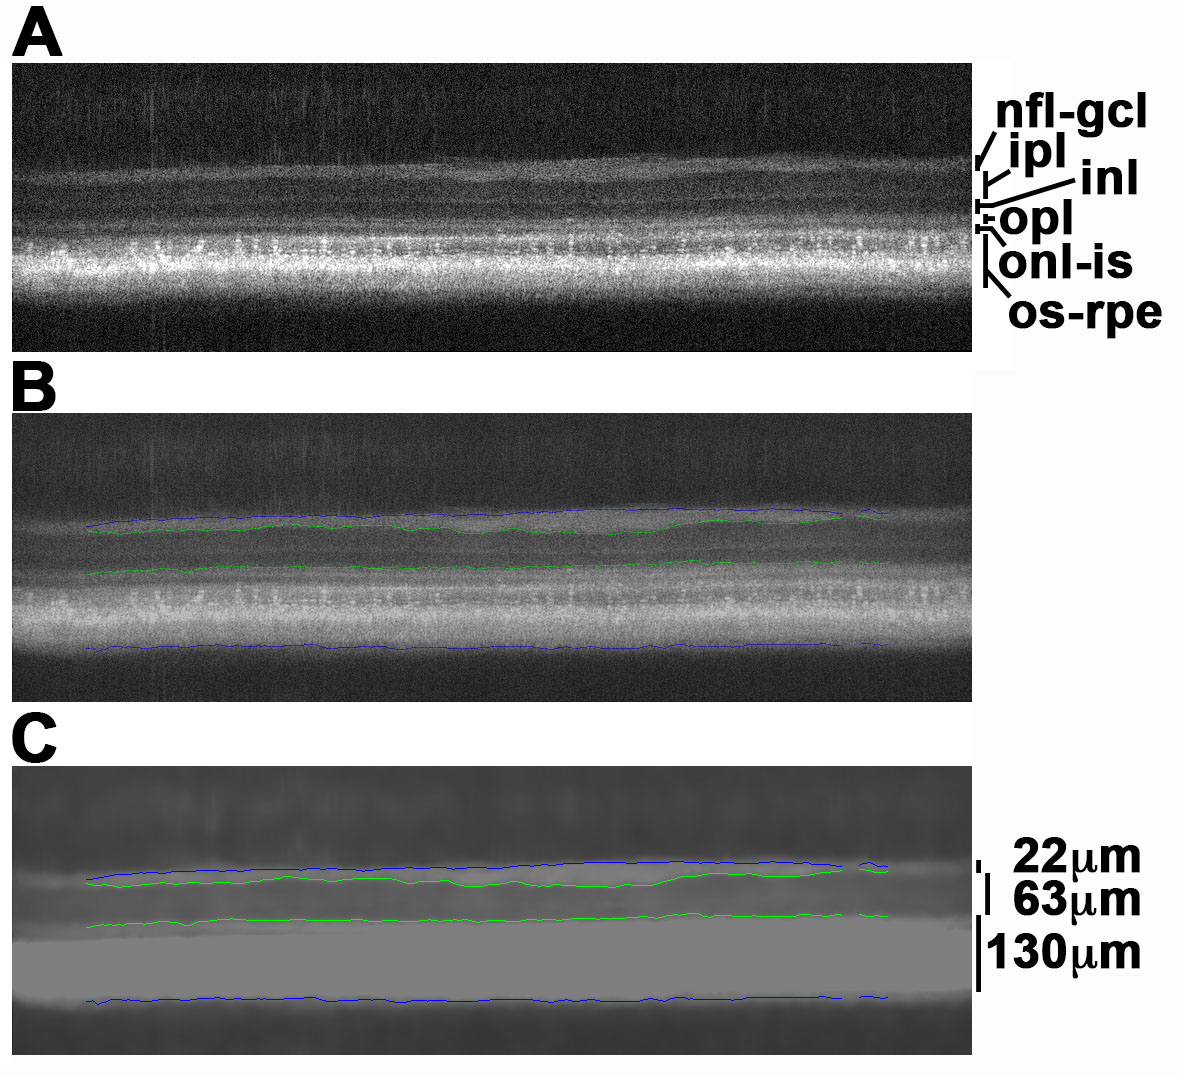
 Figure 2 of
Barter, Mol Vis 2022; 28:492-499.
Figure 2 of
Barter, Mol Vis 2022; 28:492-499.