Figure 9. HE staining images of rat retinas in each group at four months after beginning the eye drop administration. A: Blank control group; B: Right eye of NT group; C: Right eye of Mino group; D: Fellow eye of Mino group. The red arrow in B indicates abnormal dilated retinal vessels. Scale bar: 20 μm.
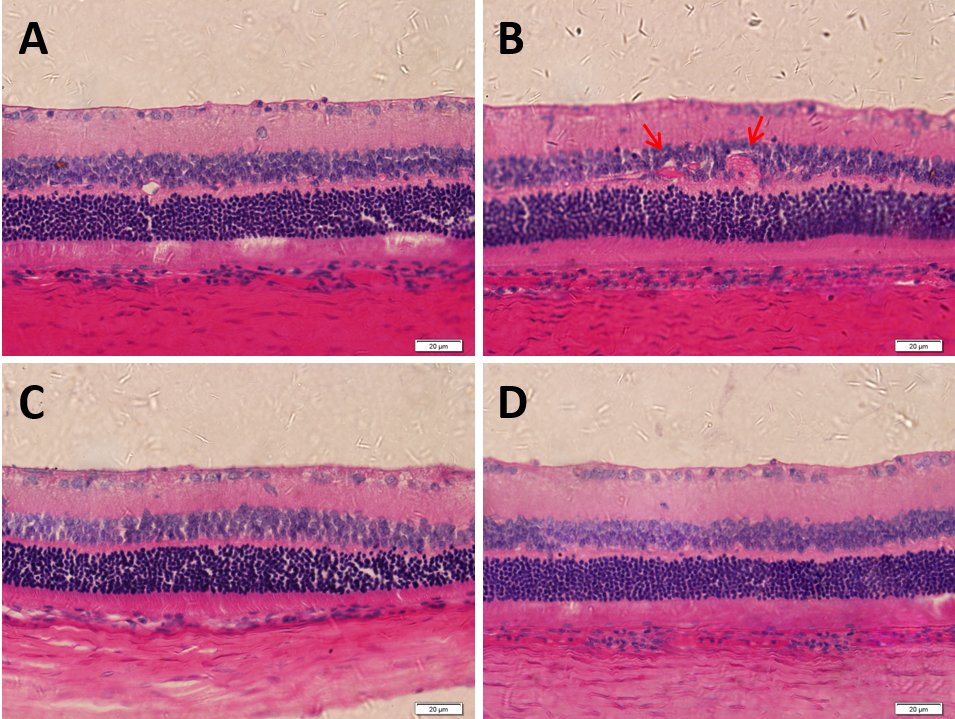
 Figure 9 of
Li, Mol Vis 2022; 28:460-479.
Figure 9 of
Li, Mol Vis 2022; 28:460-479.