Figure 7 of
Li, Mol Vis 2022; 28:460-479.
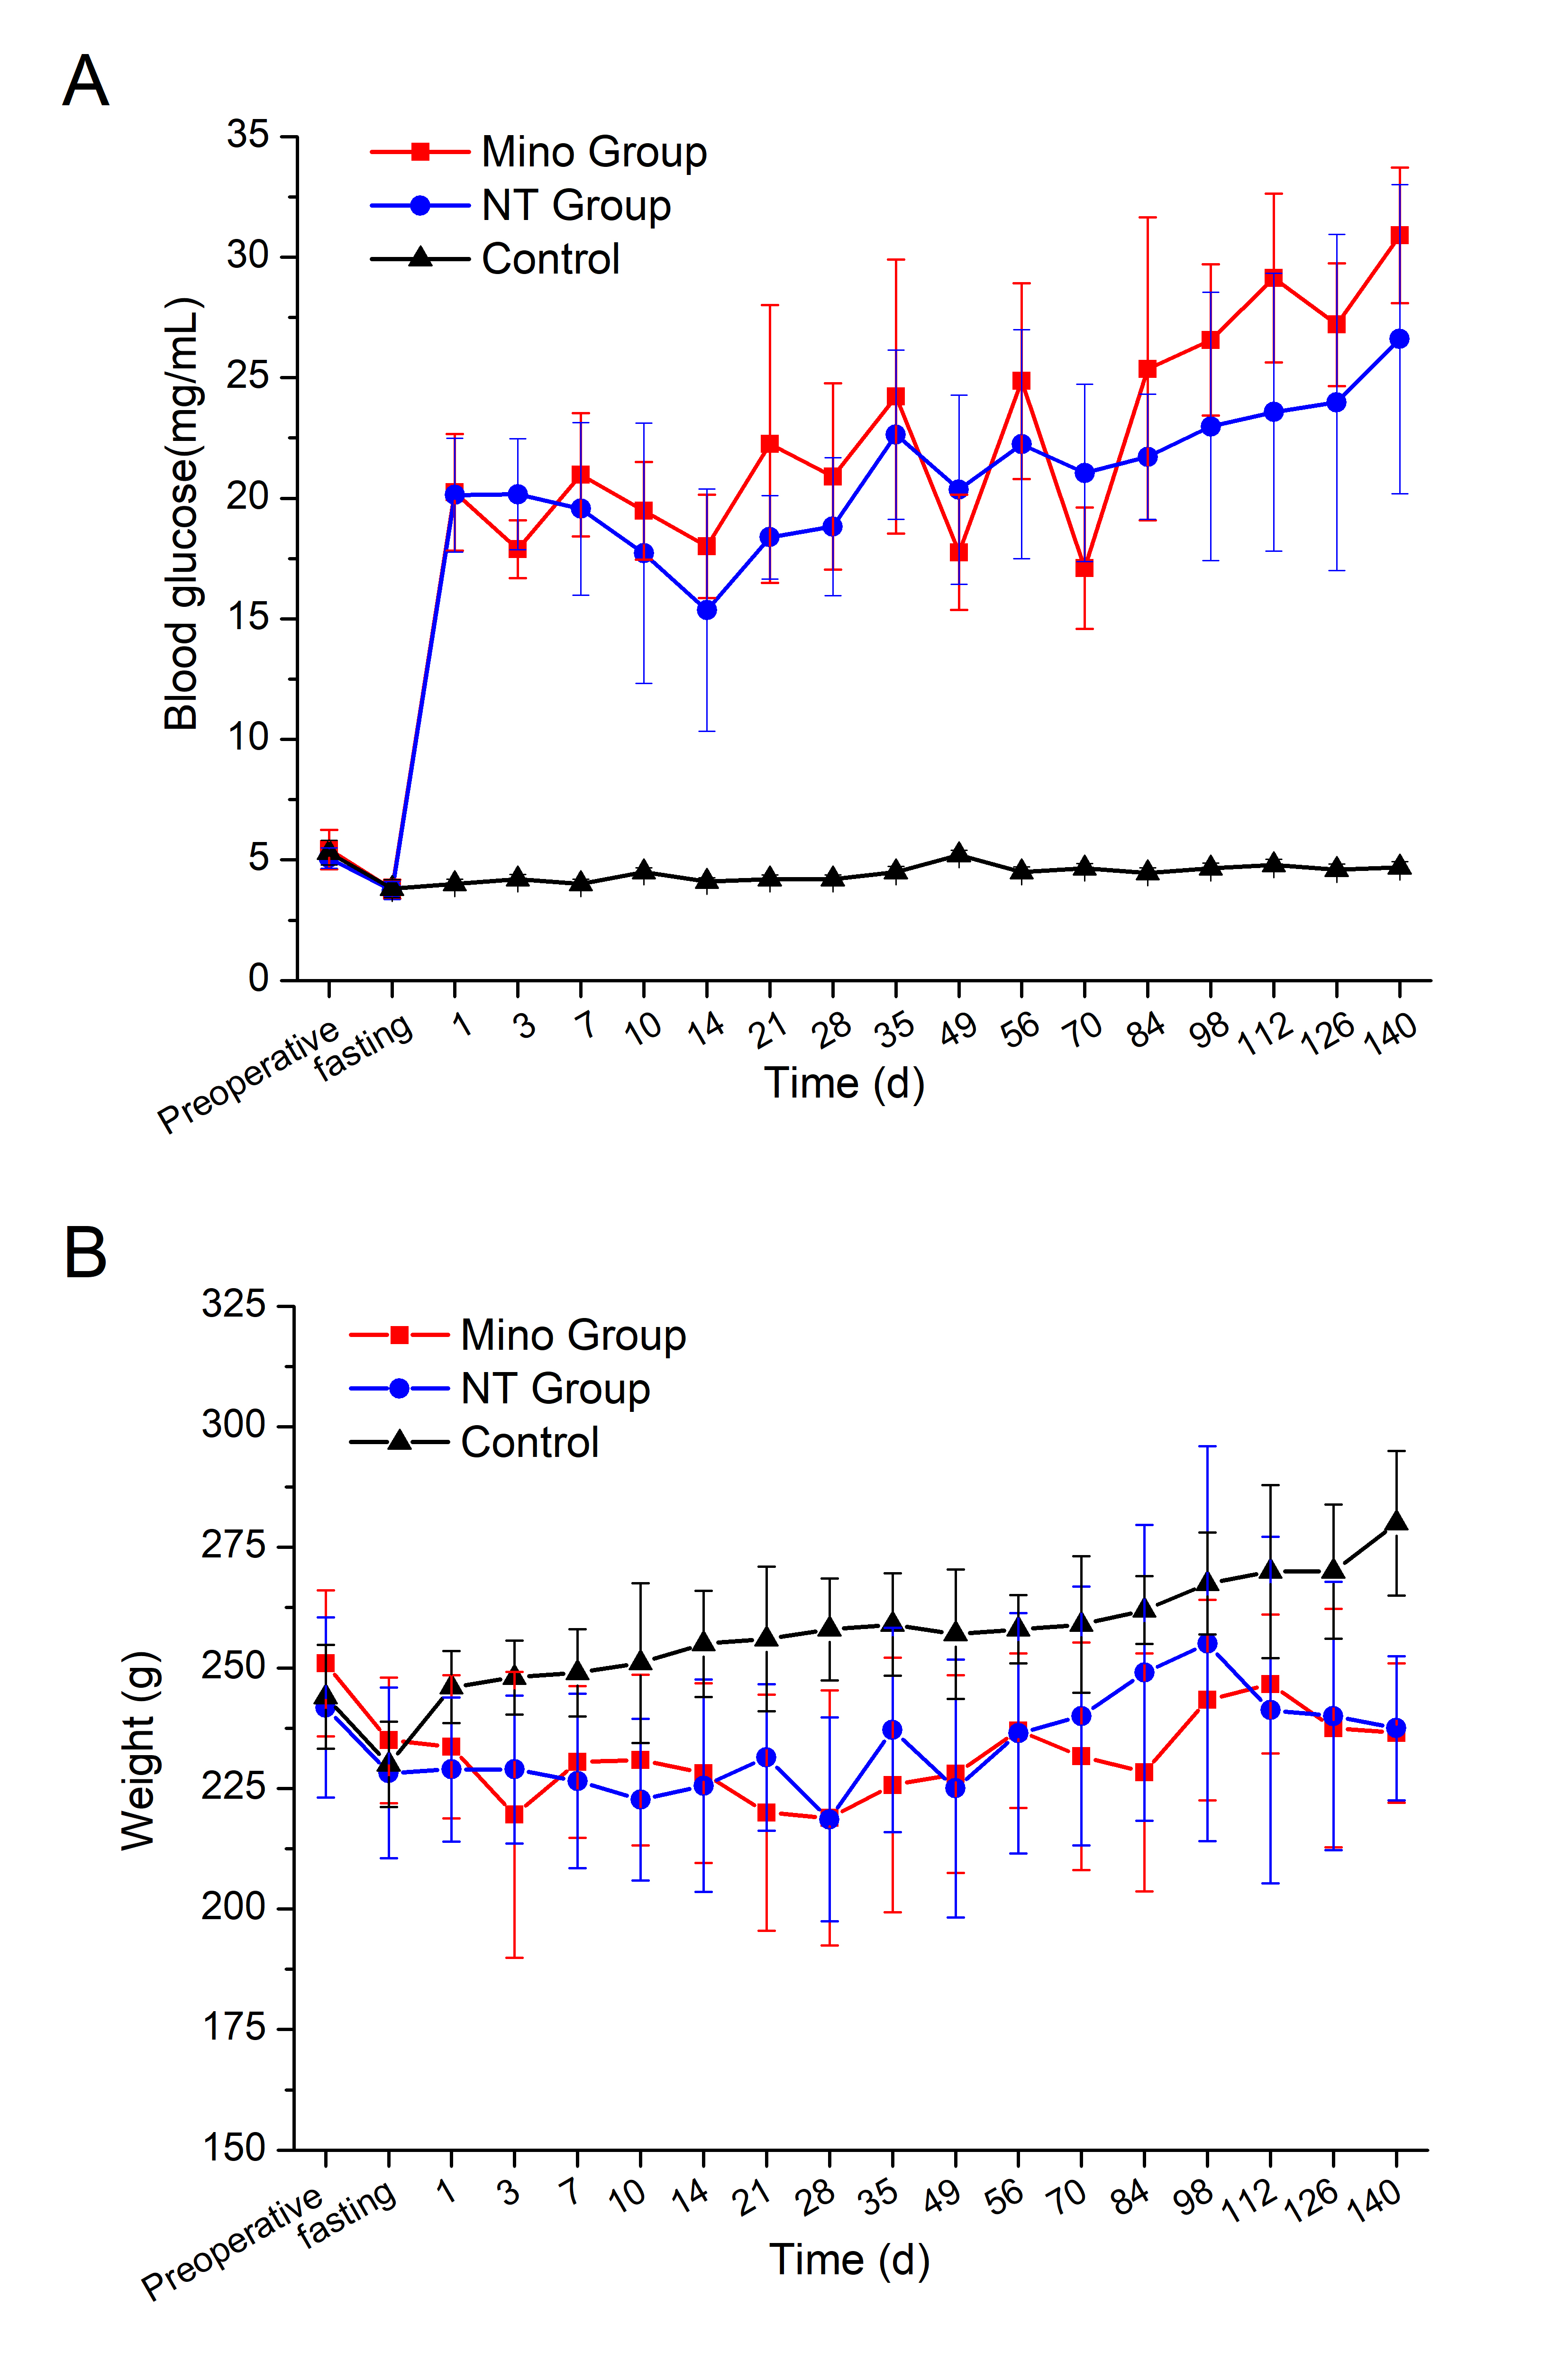
Figure 7.
Blood glucose values. (
A
) and bodyweights (
B
) of rats in each group throughout the experiment (
n
= 10).
 Figure 7 of
Li, Mol Vis 2022; 28:460-479. Figure 7 of
Li, Mol Vis 2022; 28:460-479.
Figure 7 of
Li, Mol Vis 2022; 28:460-479. Figure 7 of
Li, Mol Vis 2022; 28:460-479.