Figure 3 of
Li, Mol Vis 2022; 28:460-479.
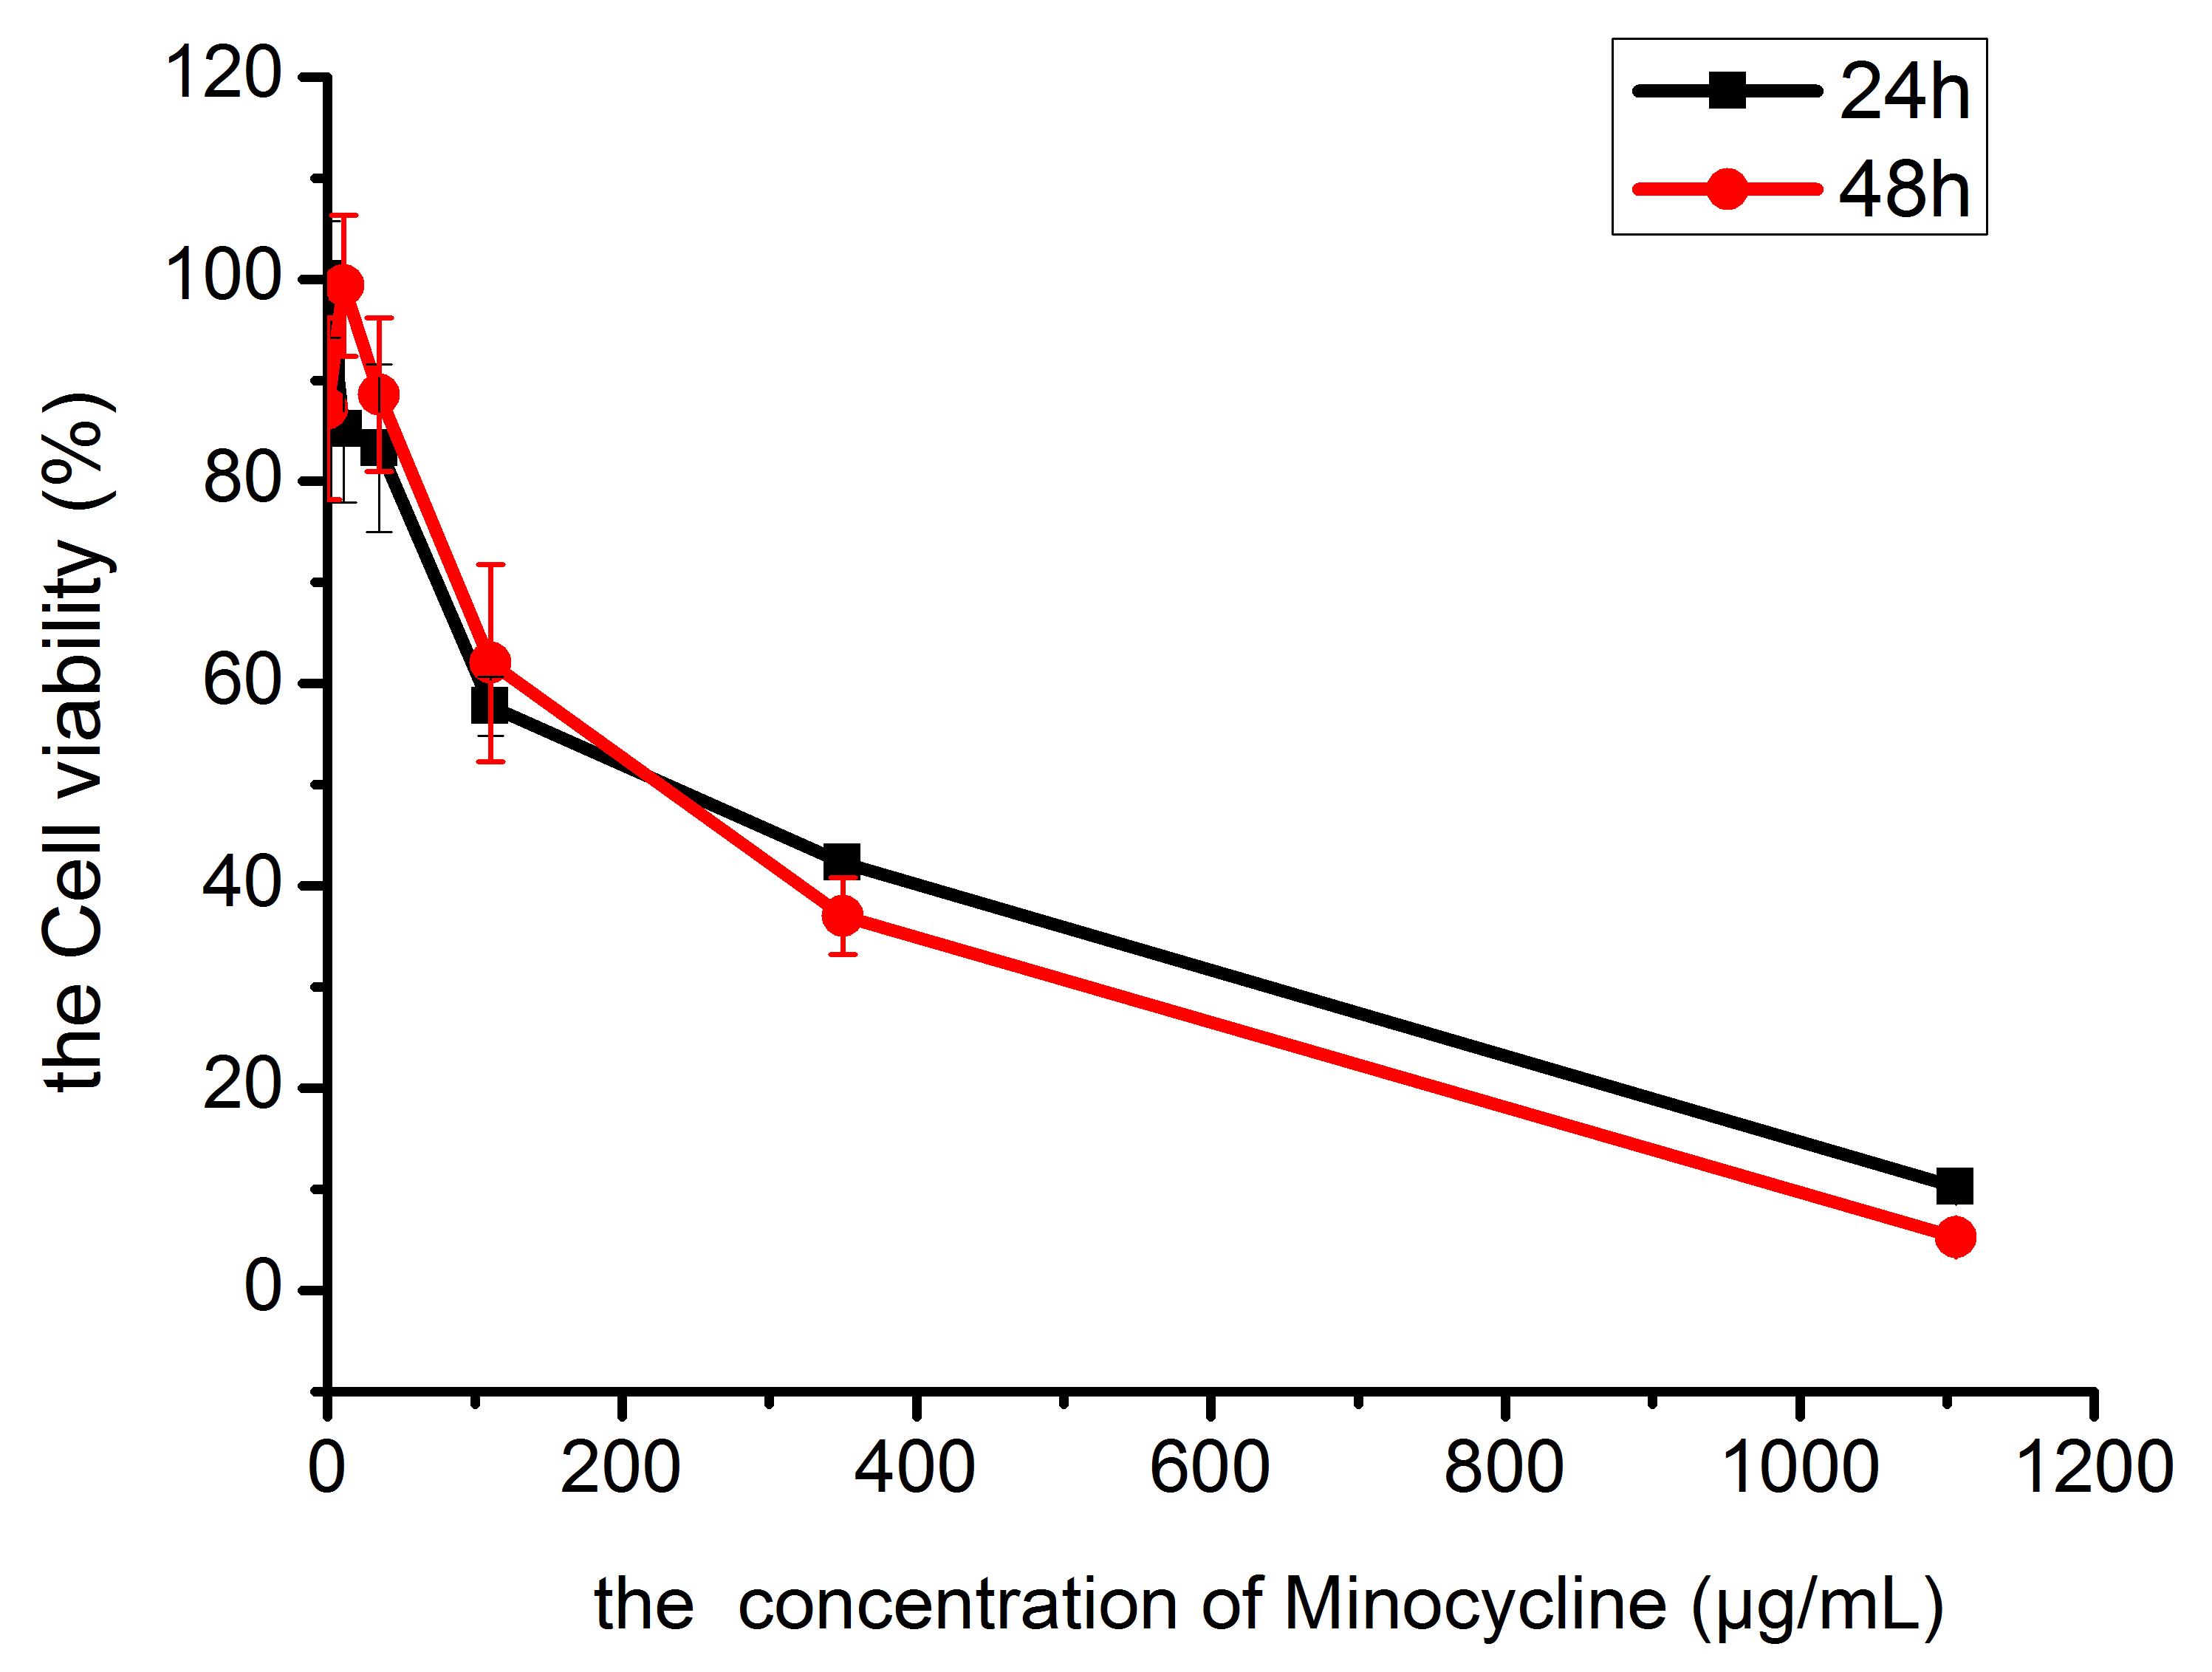
Figure 3.
Drug concentration–cell viability curves of HCECs compared among drug concentrations.
 Figure 3 of
Li, Mol Vis 2022; 28:460-479. Figure 3 of
Li, Mol Vis 2022; 28:460-479.
Figure 3 of
Li, Mol Vis 2022; 28:460-479. Figure 3 of
Li, Mol Vis 2022; 28:460-479.