Figure 1. Retina scanning positions and retinal thickness measurements during OCT examination. Panels A–C show scanning images of the x-axis; panels D–F show scanning images of the y-axis. B and E show x-axis and y-axis OCT scanning through the discus opticus alone. A and C show x-axis scanning at a distance of 0.5 PD upwards and downwards from the discus opticus. D and F show y-axis scanning at a distance of 0.5 PD rightward and leftward from the discus opticus. Red points indicate the locations
at which the retinal thickness was measured.
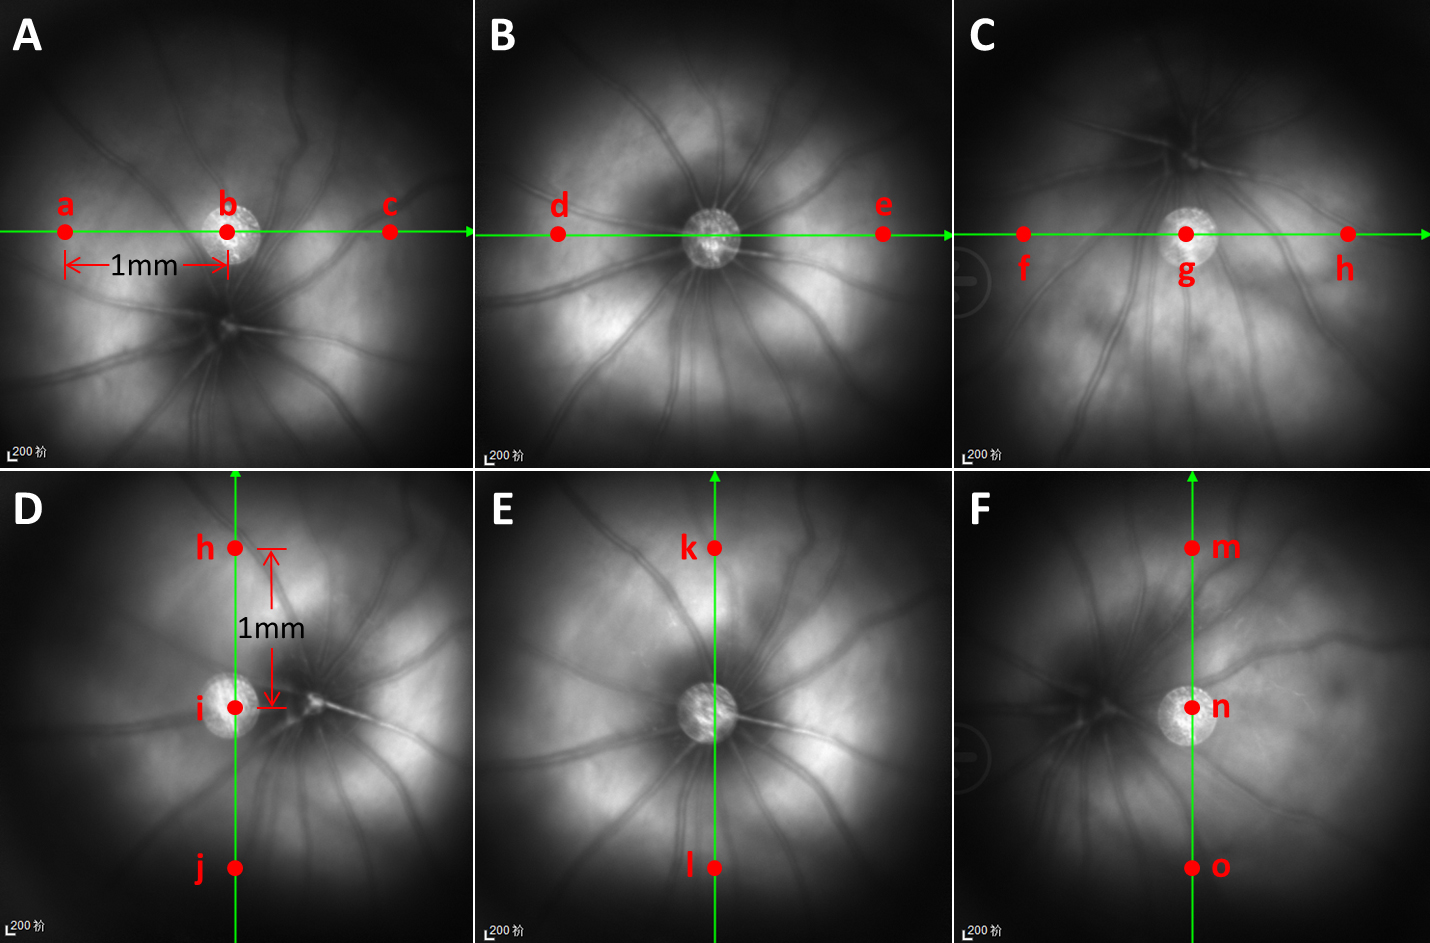
 Figure 1 of
Li, Mol Vis 2022; 28:460-479.
Figure 1 of
Li, Mol Vis 2022; 28:460-479.