Figure 5. Relative gene expression of retinal cell markers. The bar graphs represent relative expression of neural retinal cell markers
(CRABPΙ, RHO, PKCα and Thy-1) and neural progenitor/stem cell markers (PAX6, SOX2, VSX2, and Nestin) in HAF, FBS, and DMEM/F12–treated
cultures on A/G substrate compared to polystyrene. Each bar represents the mean ± SEM of at least 3 independent experiments
in at least triplicate.
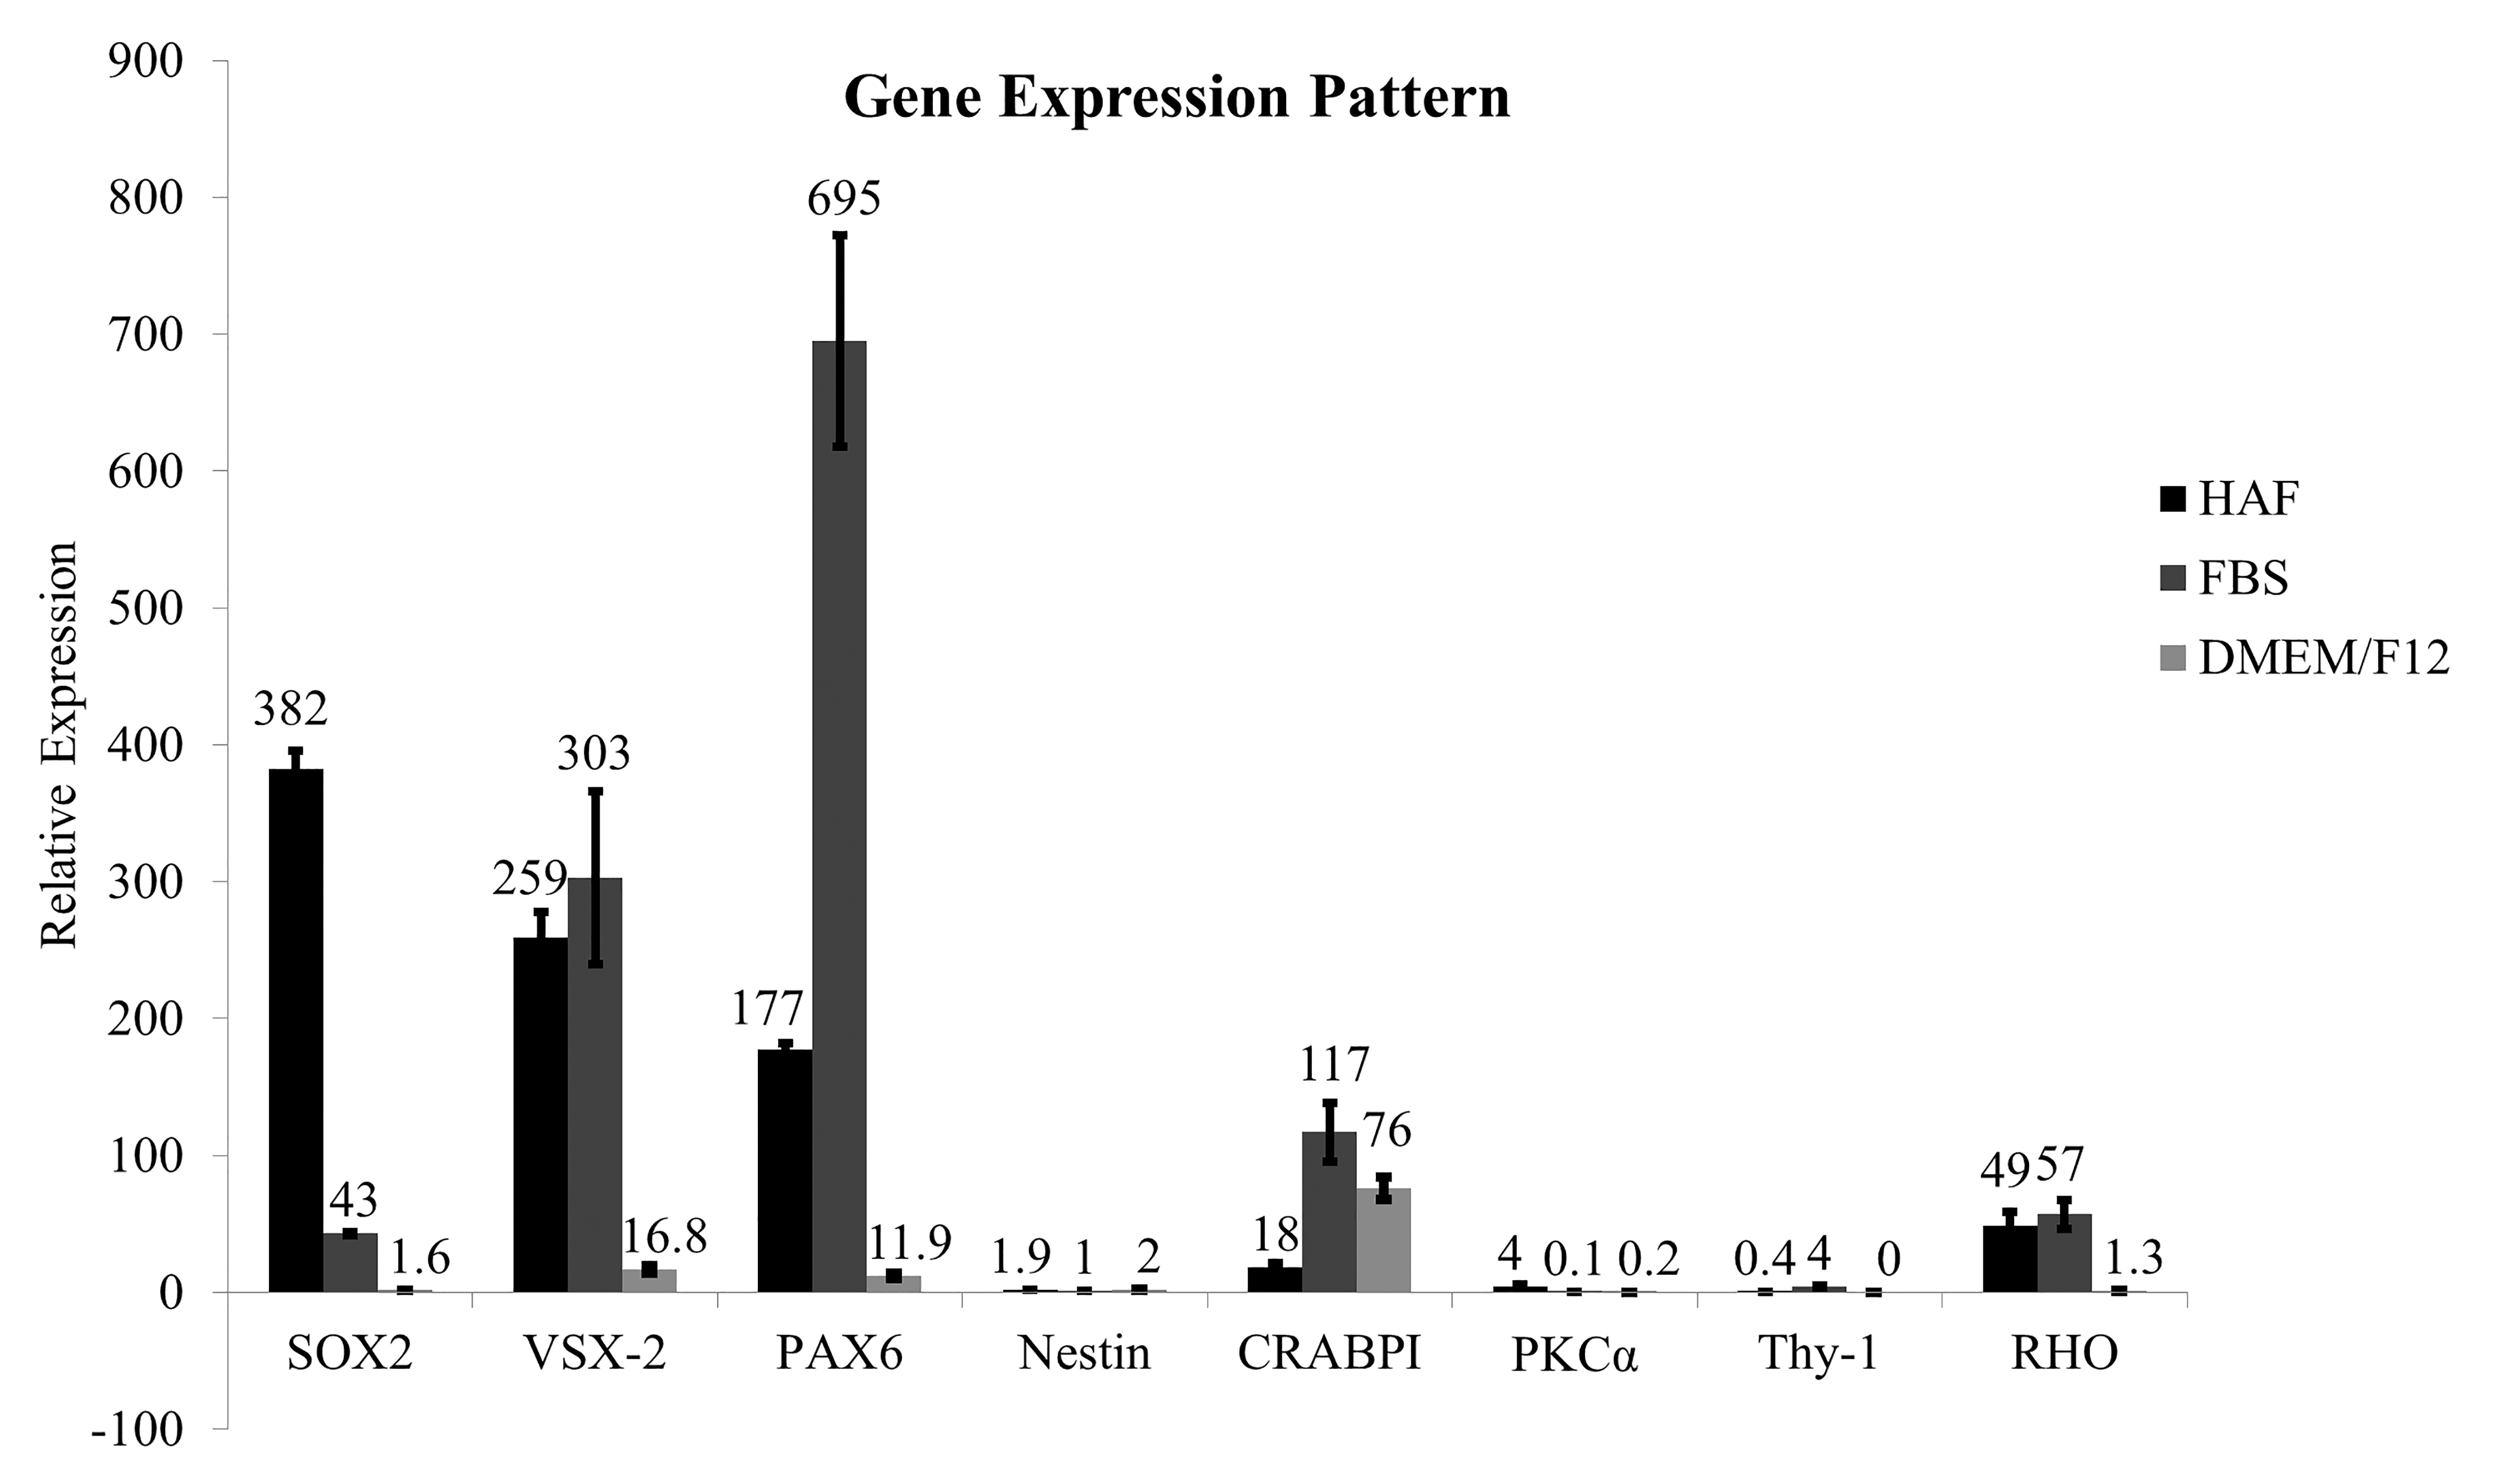
 Figure 5 of
Shamsnajafabadi, Mol Vis 2022; 28:412-431.
Figure 5 of
Shamsnajafabadi, Mol Vis 2022; 28:412-431.