Figure 3. Characterization of RPE and EMT protein biomarker expression in control (DYS) and SLOS-derived (CWI, A2) iPSC-RPE cells. A: Western blot analysis of CRALBP, BEST1, RPE65, cytoskeletal and EMT marker expression in all three RPE cell lines. A2 RPE
cells exhibited markedly lower levels of visual cycle proteins RPE65 and CRALBP, and lower levels of cell adhesion and cytoskeletal
linkers E-cadherin and ezrin, compared to CWI and DYS RPE cells. Best1 was expressed in all three RPE lines albeit at slightly
varying levels. CWI and A2 RPE cells expressed higher levels of α-smooth muscle actin (SMA), an EMT marker, compared to DYS
RPE cells. Vimentin was expressed in all three RPE cell lines and appeared variably cleaved to ~45 kDa, with modest elevation
in A2 cells. α-Tubulin (TUBA1) expression was found to be a more reliable (less-variable) “house-keeping” gene product, as
compared to β-actin (ACTB); hence, TUBA1 was employed for normalization of expression levels (see panel B). B: Fold-change values (based on semi-quantitative densitometry) for RPE and EMT protein markers in SLOS-derived vs. control
RPE cells, normalized to TUBA1 (n=3, *p<0.01, # p<0.05). C: Heatmap of RPKM levels for the RPE signature genes identified by Liao et al. (30) in each of the iPSC-RPE cell lines. Between
82 (A2) and 85 (CWI and DYS) of the 86 signature genes were expressed in the iPSC-RPE cell lines, albeit many at low levels.
D: Dot plot representation of Pathway analysis of Biological Processes using clusterProfiler. Cell junction assembly, cell-substrate
adhesion, extracellular matrix organization, and actin cytoskeleton-associated pathways were found to be significantly altered
in both of the SLOS-derived RPE cell lines, vs. DYS RPE cells. (Inset): Image of cell pellets derived from the three RPE cell lines, demonstrating that the melanin content of DYS RPE cells was
substantially greater than that of CWI and A2 RPE cells.
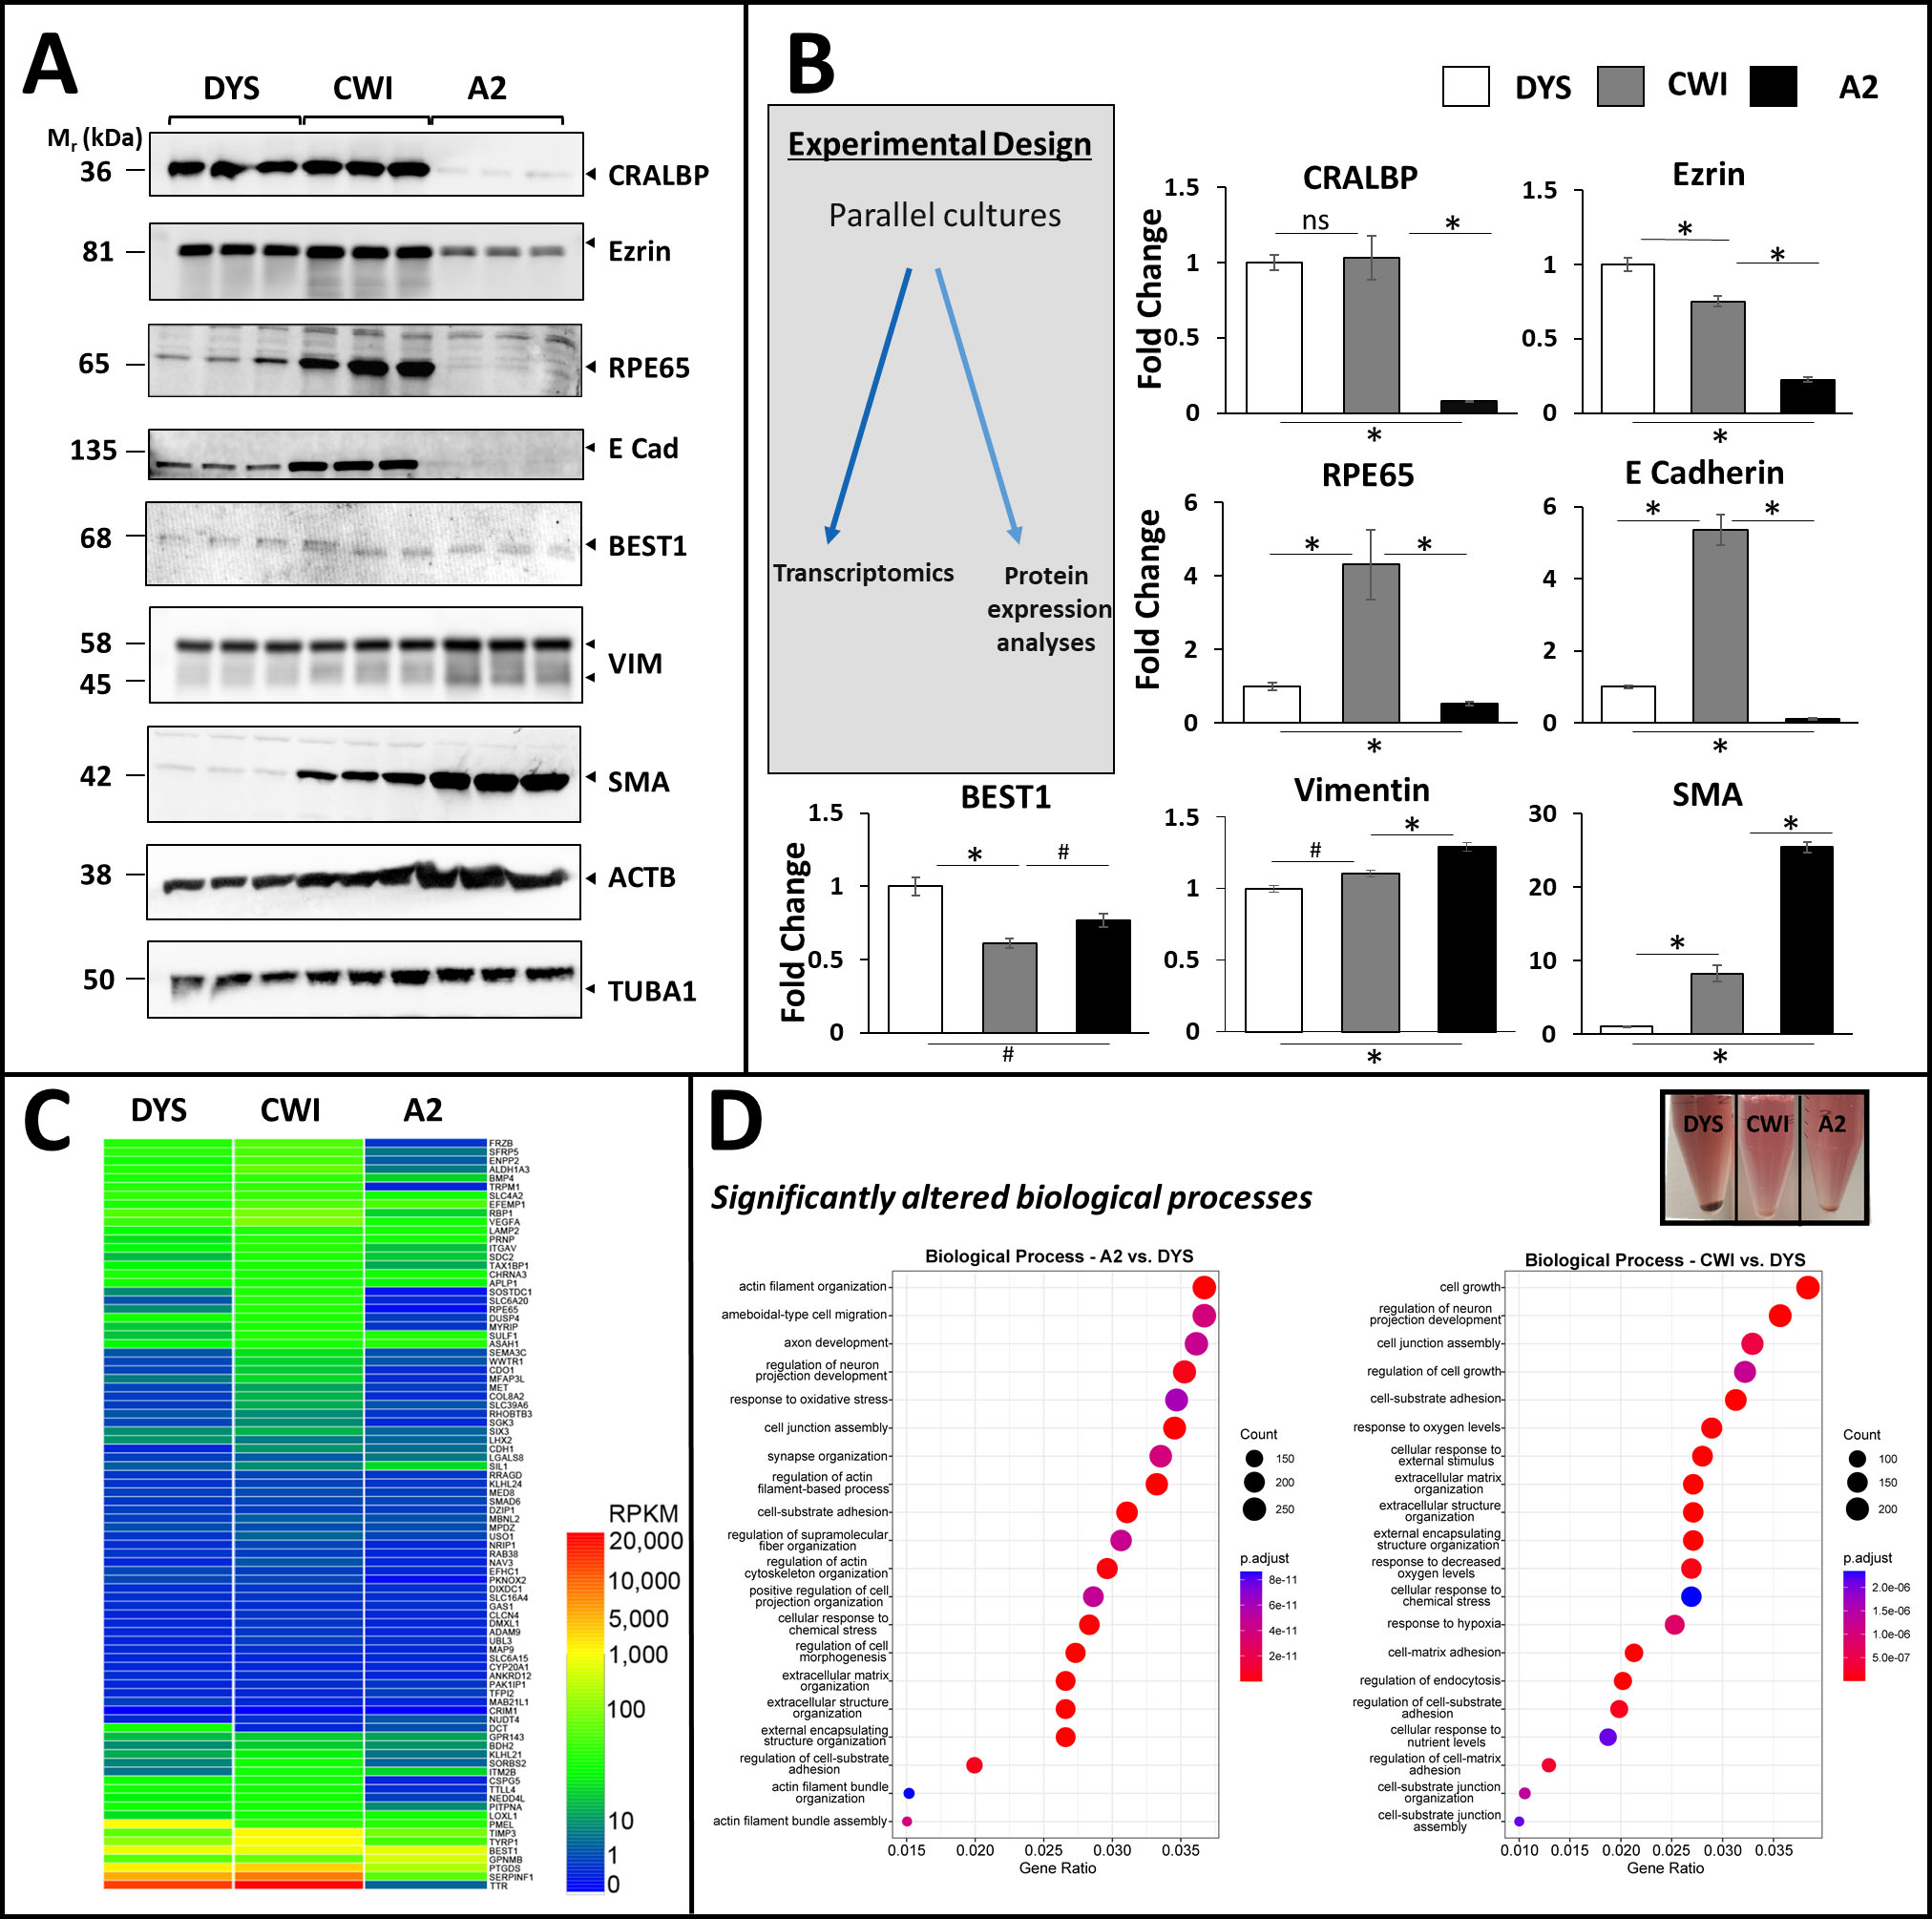
 Figure 3 of
Farkas, Mol Vis 2022; 28:394-411.
Figure 3 of
Farkas, Mol Vis 2022; 28:394-411.