Figure 2. Whole transcriptome analysis of SLOS-derived (CWI and A2) versus control (DYS) iPSC-RPE cells. A: Of the 65,439 genes and 113,246 isoforms in the GENCODE24 annotation database, expression of ~14,500 genes was detected
in all three cell lines (see color key, inset), with 31,976, 33,291, and 28,688 isoforms detected (RPKM >1) in the A2, CWI, and DYS RPE samples, respectively. RPKM values
of <1 are considered as non-expressed isoforms/transcripts. B: All three RPE cell lines had 25,589 isoforms in common, which corresponds to 77%–89% of the total isoform expression. However,
the two SLOS-derived (CWI and A2) samples showed the highest degree of overlap (29,165 isoforms). In contrast to the inter-sample
concordance, CWI and DYS RPE cells showed a higher degree of overlap in isoform expression (27,317 isoforms) than did A2 and
DYS RPE cells (26,027 isoforms). C: Bar graph representation comparing upregulated and downregulated isoforms in DYS versus A2, DYS versus CWI, and CWI versus
A2 RPE cells, respectively, as a function of fold change.
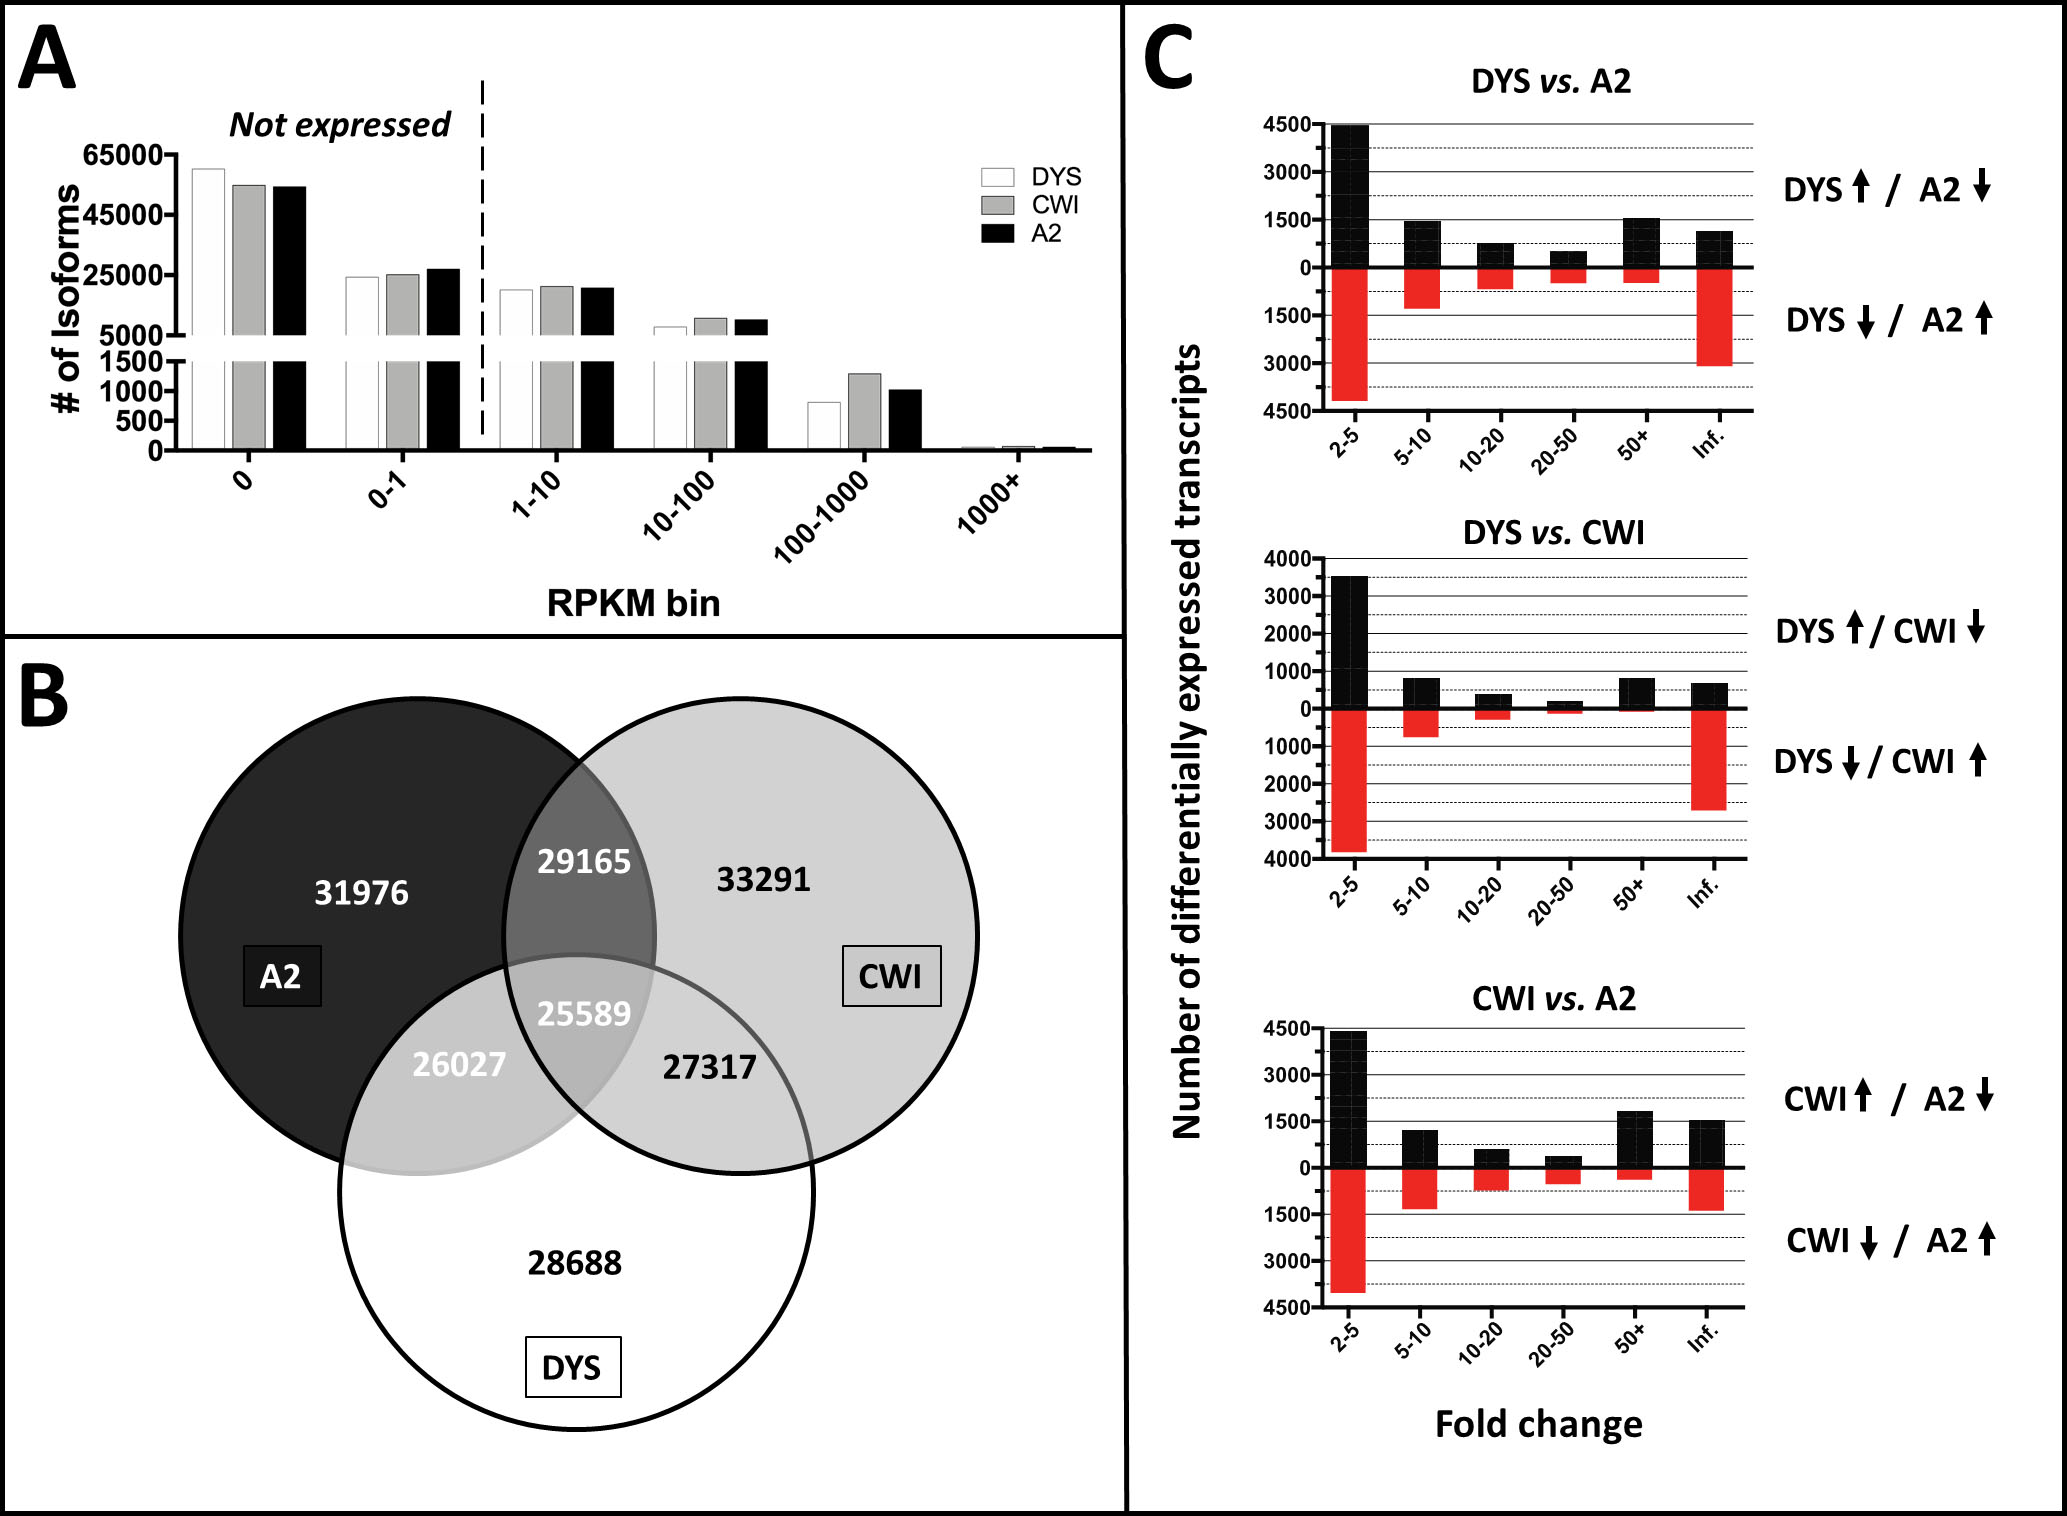
 Figure 2 of
Farkas, Mol Vis 2022; 28:394-411.
Figure 2 of
Farkas, Mol Vis 2022; 28:394-411.