Figure 1. Plots of GDNF content in aqueous humor (A), lacrimal fluid (B), and blood serum (C) versus the Humphrey visual field index (VFI) in the main group. The solid line represents the linear regression fit. Note
the reversed x-axis. The dotted line is the average concentration of GDNF in the comparison group. Pearson’s correlation coefficients
are as follows: −0.289 (p = 0.122) in (A), −0.465 (p = 0.01) in (B), and −0.399 (p = 0.029) in (C).
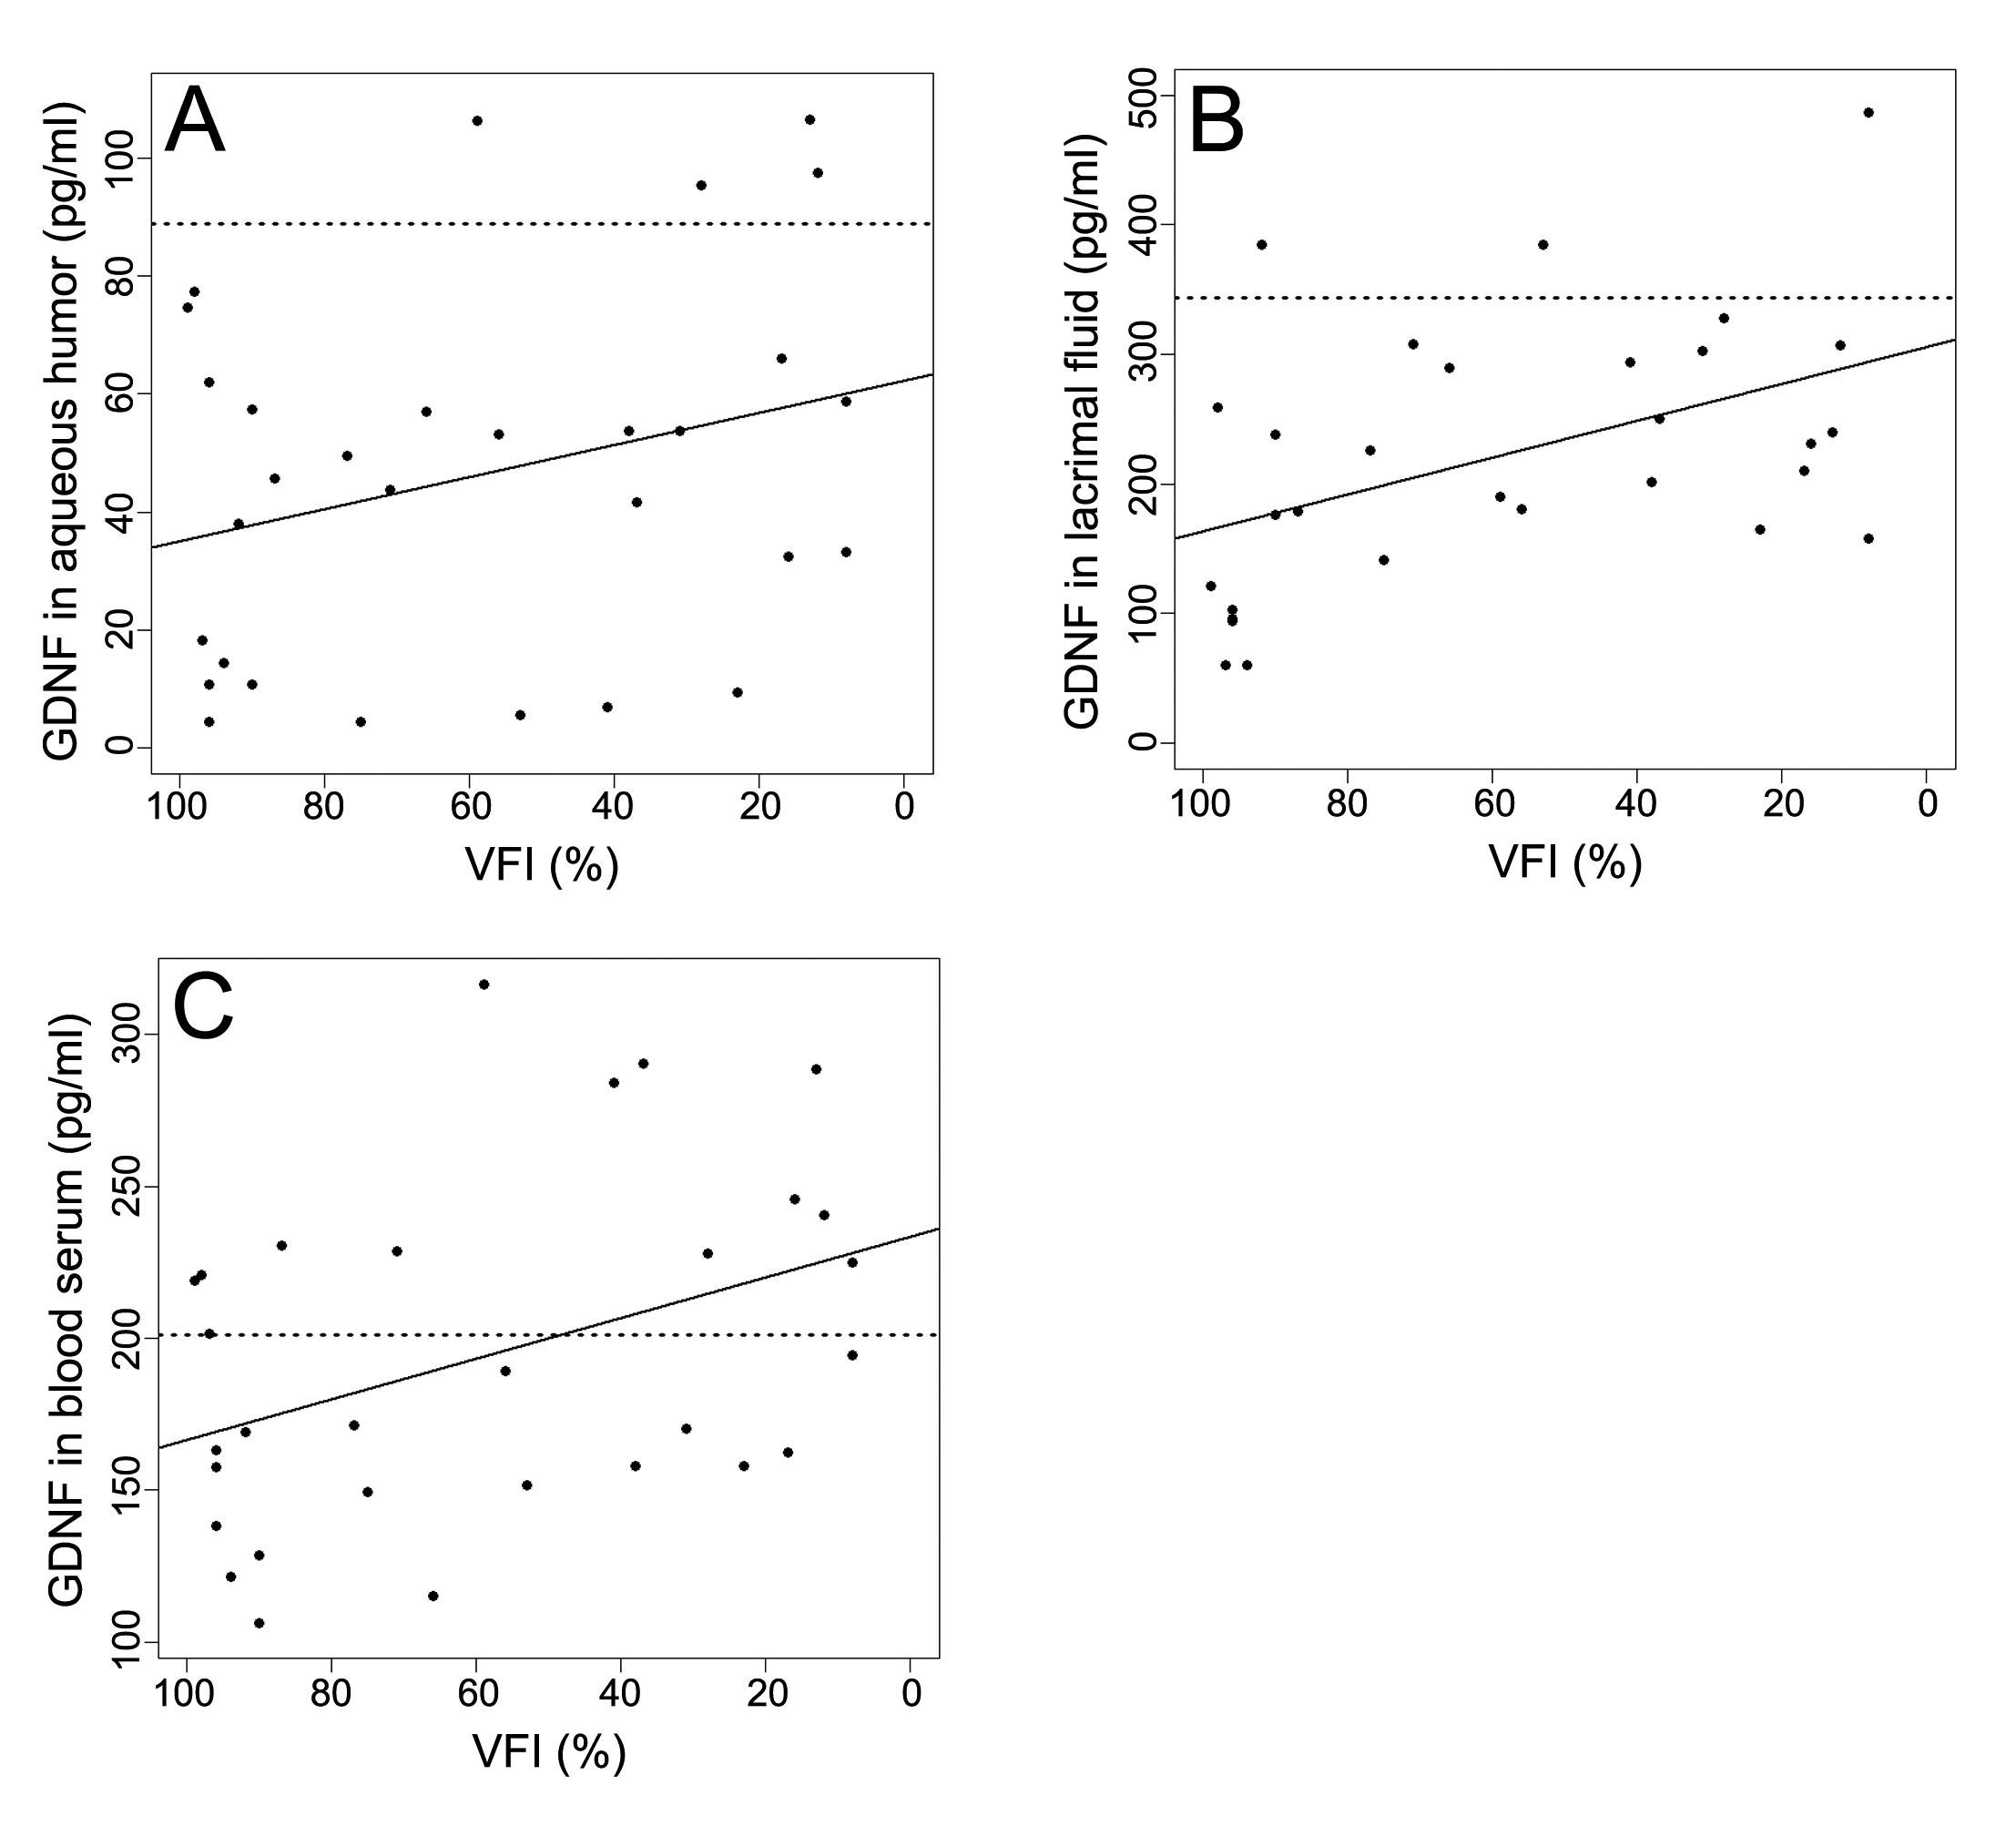
 Figure 1 of
Shpak, Mol Vis 2022; 28:39-47.
Figure 1 of
Shpak, Mol Vis 2022; 28:39-47.