Figure 2. RPE transcript localization is altered by oxidative stress. All transcripts localized to the nucleus (A), cytoplasm (B), or showing mixed localization (C) in control samples (blue), treated samples (yellow), or both (green). Bar graph shows the number of transcripts with altered
localization after treatment (D). Transitions from control to treated are indicated (e.g., Nuc → Cyt indicates transcripts that are nuclear localized in
the control samples and cytoplasmically localized in the treated samples).
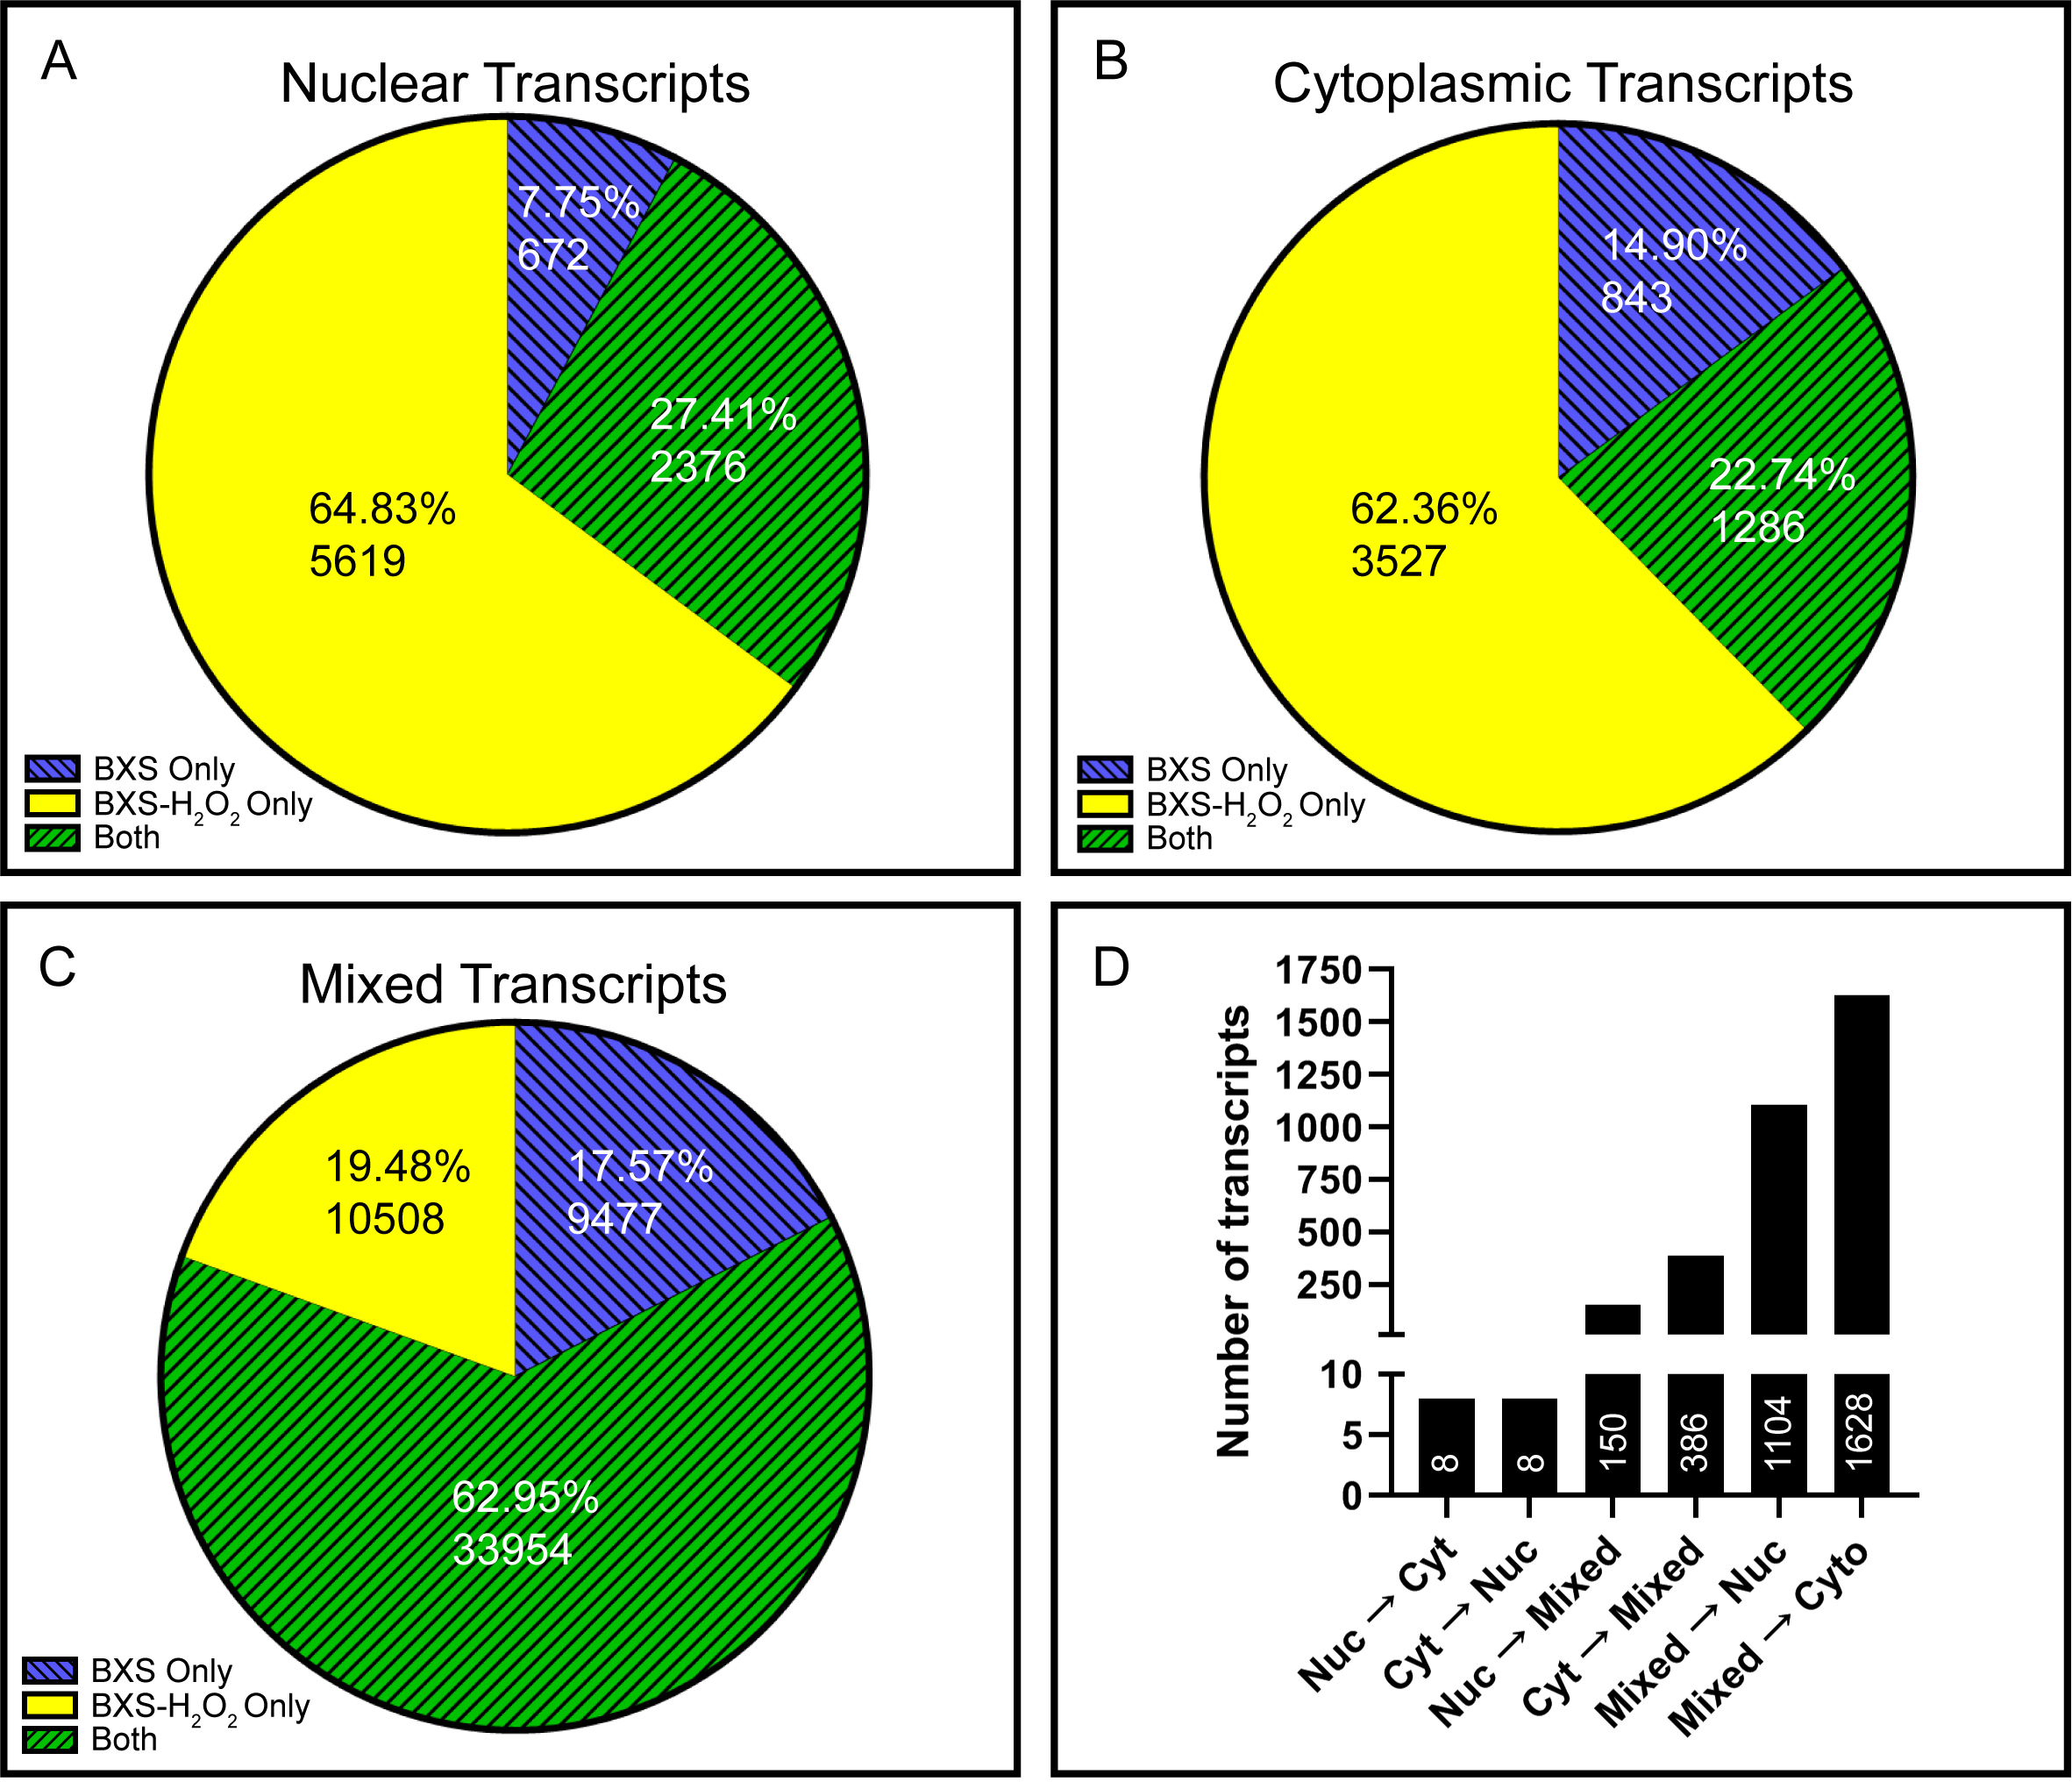
 Figure 2 of
Kaczynski, Mol Vis 2022; 28:340-351.
Figure 2 of
Kaczynski, Mol Vis 2022; 28:340-351.