Figure 1. Distribution of coding transcripts in the RPE. Volcano plots of all transcripts in control BXS iPSC-RPE (A) and H2O2-treated BXS iPSC-RPE (B). Log2 cytoplasm:nuclear fold change and corresponding log10 adjusted p value are plotted for each transcript. Transcripts with fold change >2 are colored blue, adjusted p<0.01 are green,
and both fold change >2 and adjusted p<0.01 are yellow. Genes confirmed via FISH are red (A). Note that BAX is not expressed in the nuclear fraction; hence, it has infinite fold change and is not seen on the plot.
(C) RNA-FISH images from BXS0114 iPSC-RPE cells confirming localization of SEC31B, BAX, and HSD17B4 (red) and counterstained
with Hoechst solution (blue). Arrows indicate some of the localized RNAs. Scale bar is 5 µm.
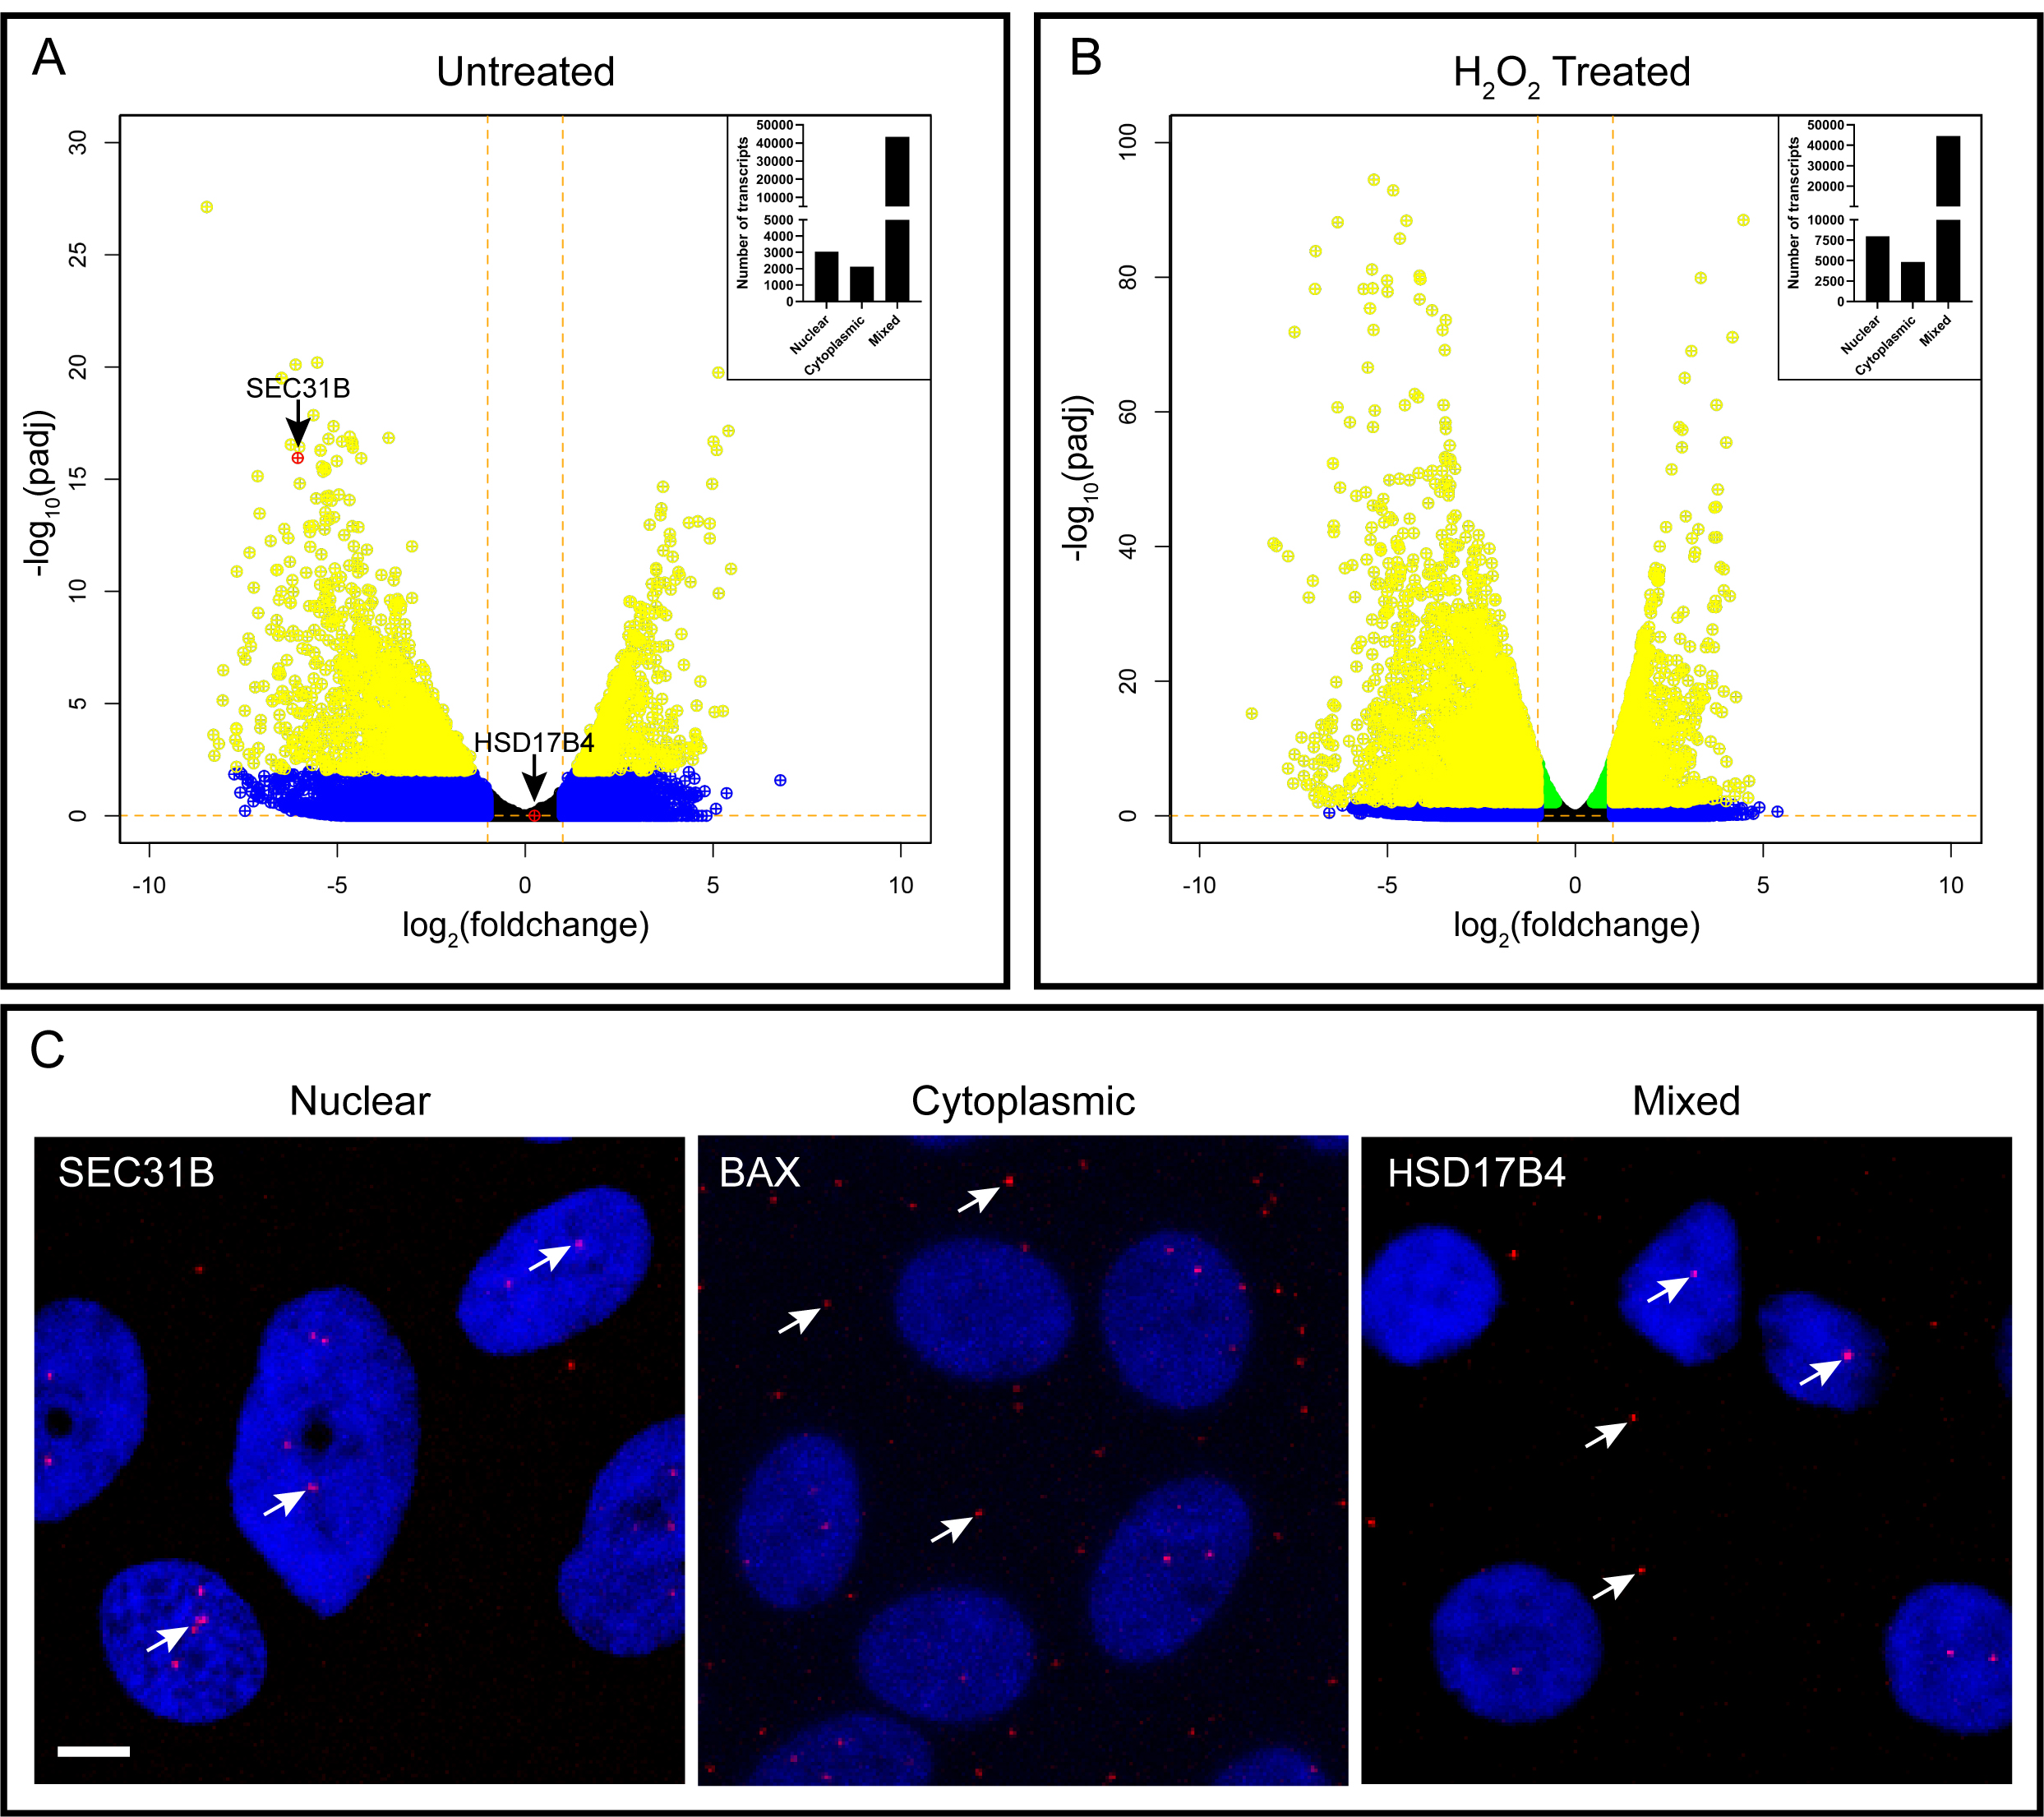
 Figure 1 of
Kaczynski, Mol Vis 2022; 28:340-351.
Figure 1 of
Kaczynski, Mol Vis 2022; 28:340-351.