Figure 2. Cell functionality throughout the cell expansion of corneal endothelial cells isolated with EDTA or collagenase A. A: Phase-contrast images of cultured corneal endothelial cells throughout cell expansion. n = 4. Donor age ± standard deviation
(SD) = 55±11 years old. B: Circularity index of cultured corneal endothelial cells throughout cell expansion. n = 4; 100 cells (four images) per condition
per population were measured. White bars = EDTA, black bars = collagenase A. C: Transendothelial electrical resistance (TEER) measurements throughout time. TEER was measured for ten media changes (Δ;
media changes were performed every 2 days). Mean ± Standard error of the mean (SEM) of one representative cell population.
D: TEER measurements at the final media change, where nine measures per population per condition were taken. Mean ± SEM of
four different cell populations. Two-way ANOVA was performed with GraphPad Prism 7. *p≤0.05. E: Indirect immunofluorescent staining of ZO-1 (red). Cell nuclei were counterstained with Hoechst (blue). Negative control
(primary antibody omitted). n = 4. Scale bar = 50 μm.
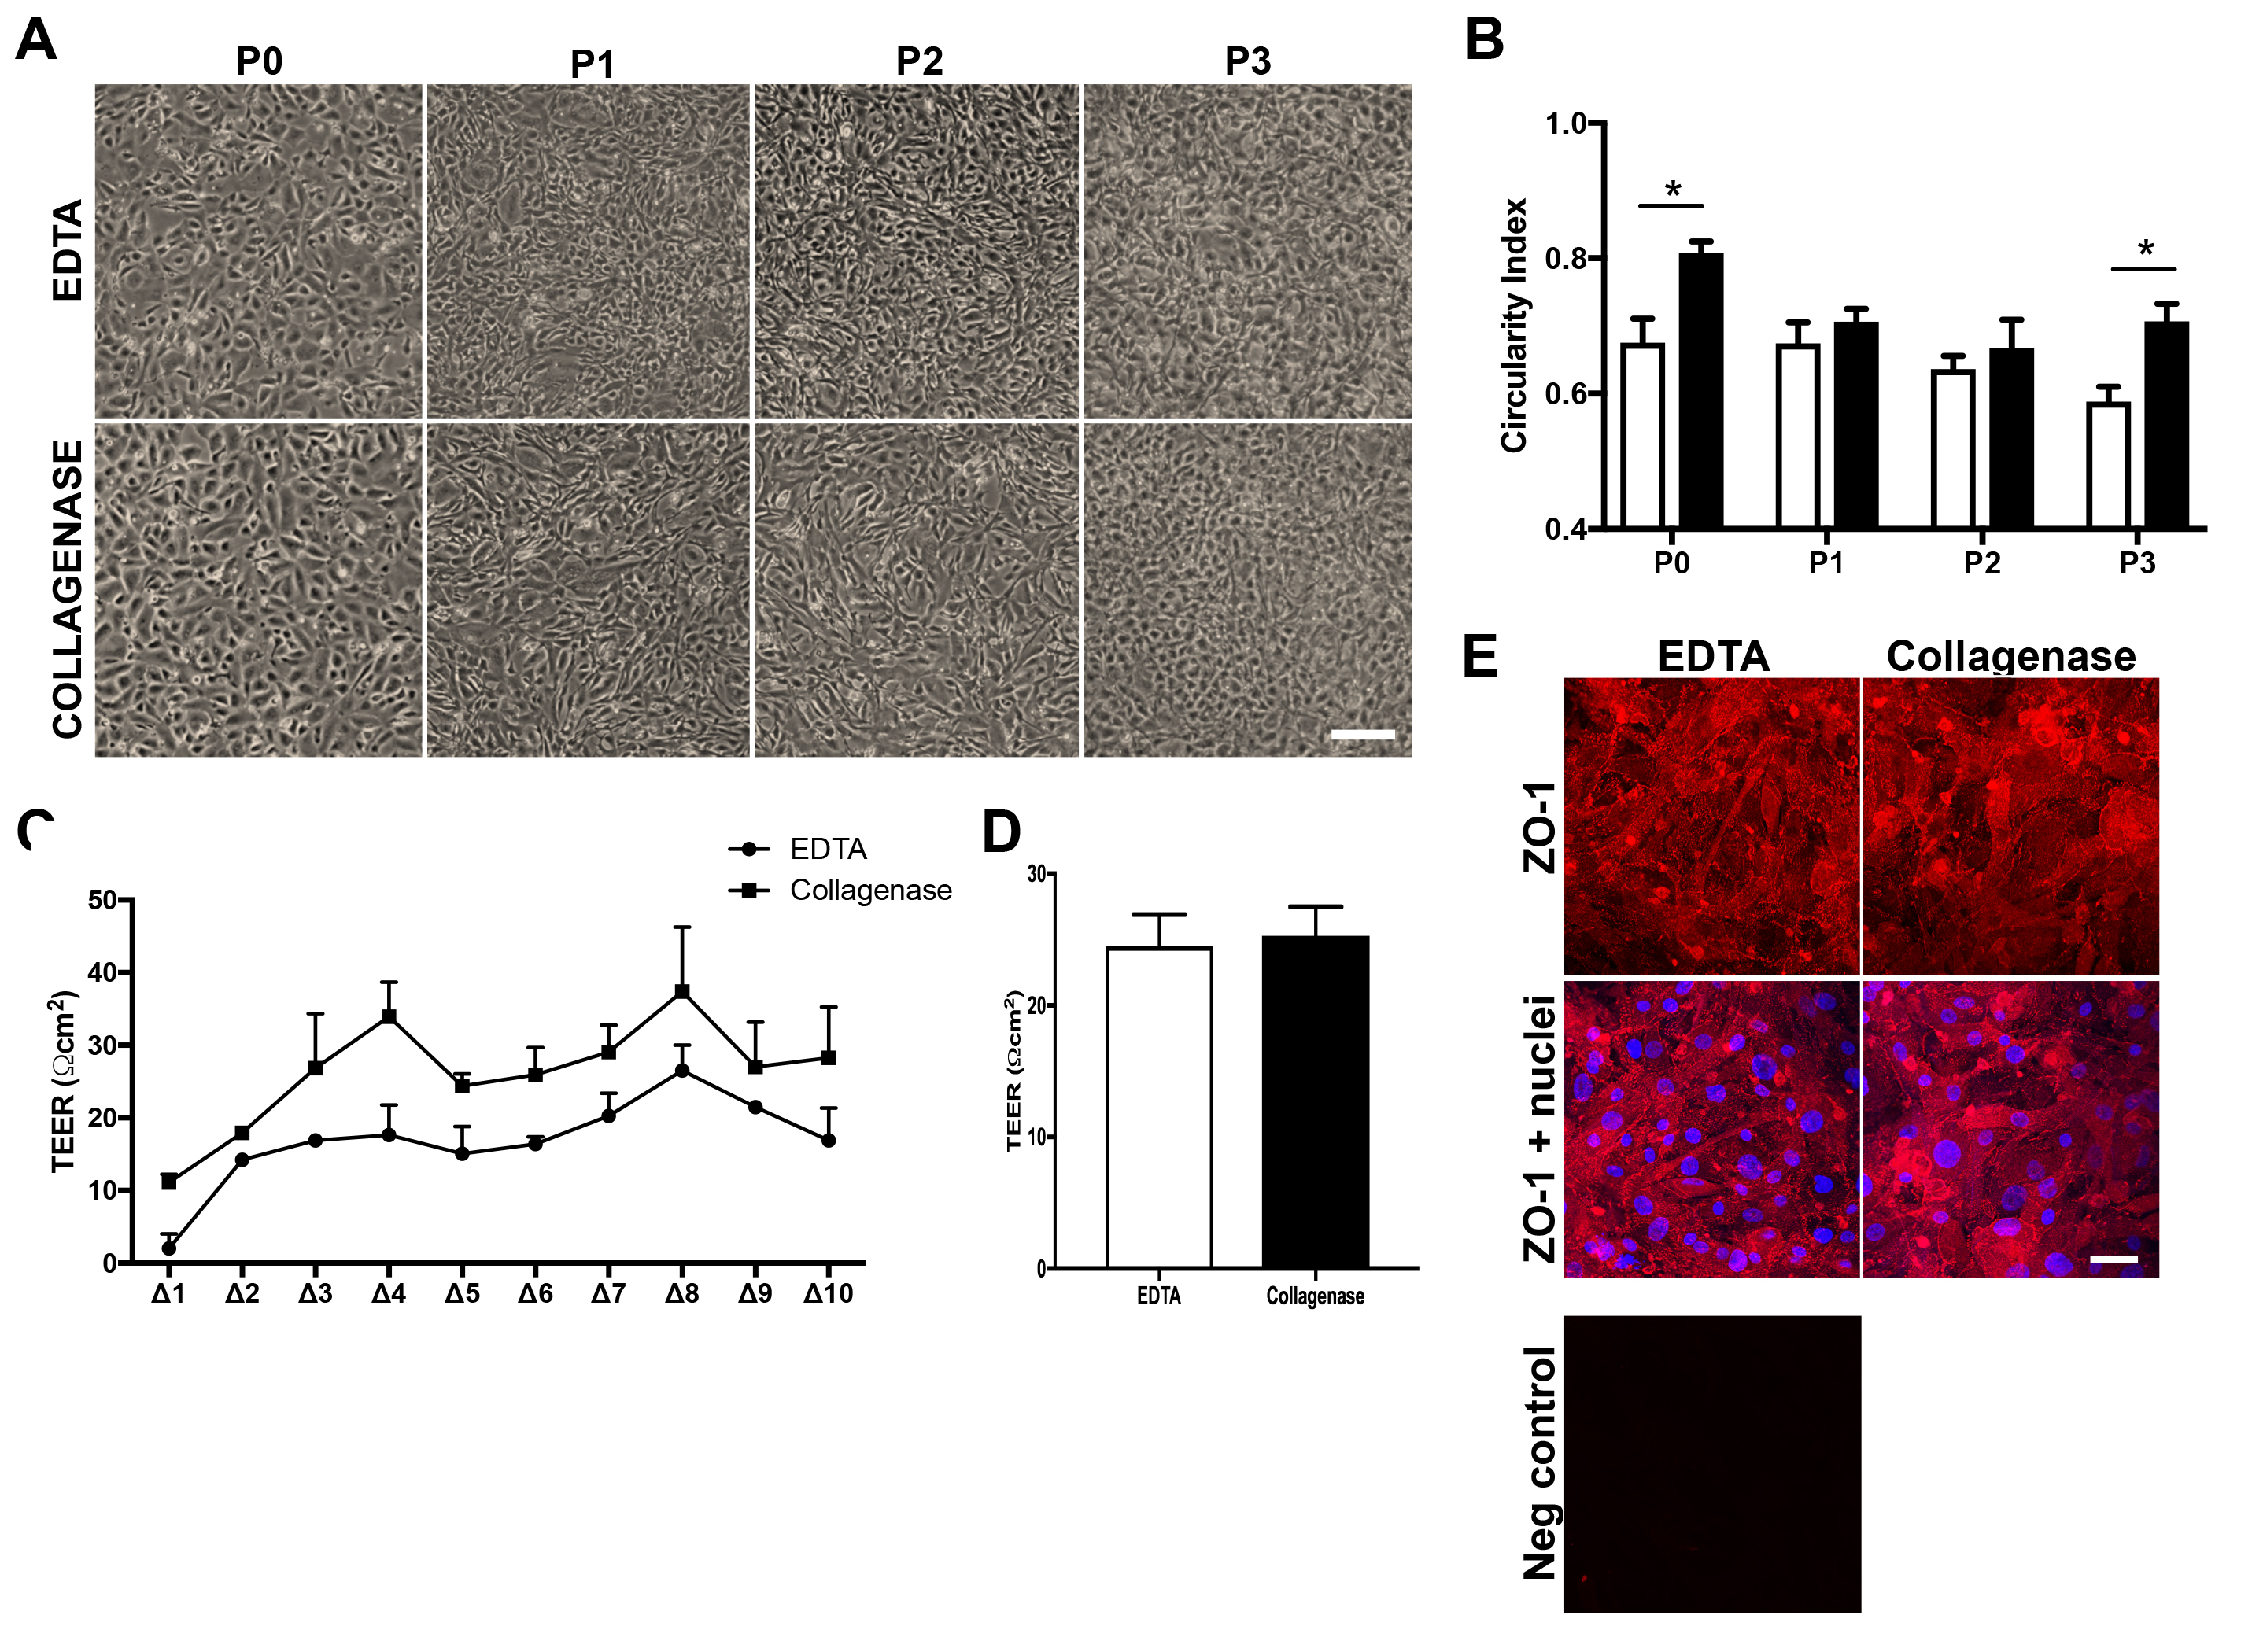
 Figure 2 of
Santerre, Mol Vis 2022; 28:331-339.
Figure 2 of
Santerre, Mol Vis 2022; 28:331-339.