Figure 1. Primary (P0) cultures of corneal endothelial cells isolated with EDTA or collagenase A. A: Cell viability, 2 h after cell isolation, relative to the EDTA condition. n = 6. B: Percentage of cells isolated from native Descemet membranes. n = 4. C: Percentage of dead cells immediately following cell isolation from Descemet membranes. n = 4. D: Representative images of indirect immunofluorescence staining of Ki67 (red), actin (green), and nuclei (blue) at 24 h postseeding.
Scale bar = 100 μm. E: Relative expression of Ki67-expressing cells (reported on nuclei). n = 3. F: Phase-contrast images of P0-cultured corneal endothelial cells at 24 h and 7 days postseeding. Scale bar = 200 µm. G: Representative images of indirect immunofluorescence staining of ZO-1 (red), N-cadherin (red), and actin (green) at 7 days
postseeding. Scale bar = 50 µm. Results are expressed as mean ± standard error of the mean (SEM). Two-way ANOVA was performed
with GraphPad Prism 7. *p≤0.05.
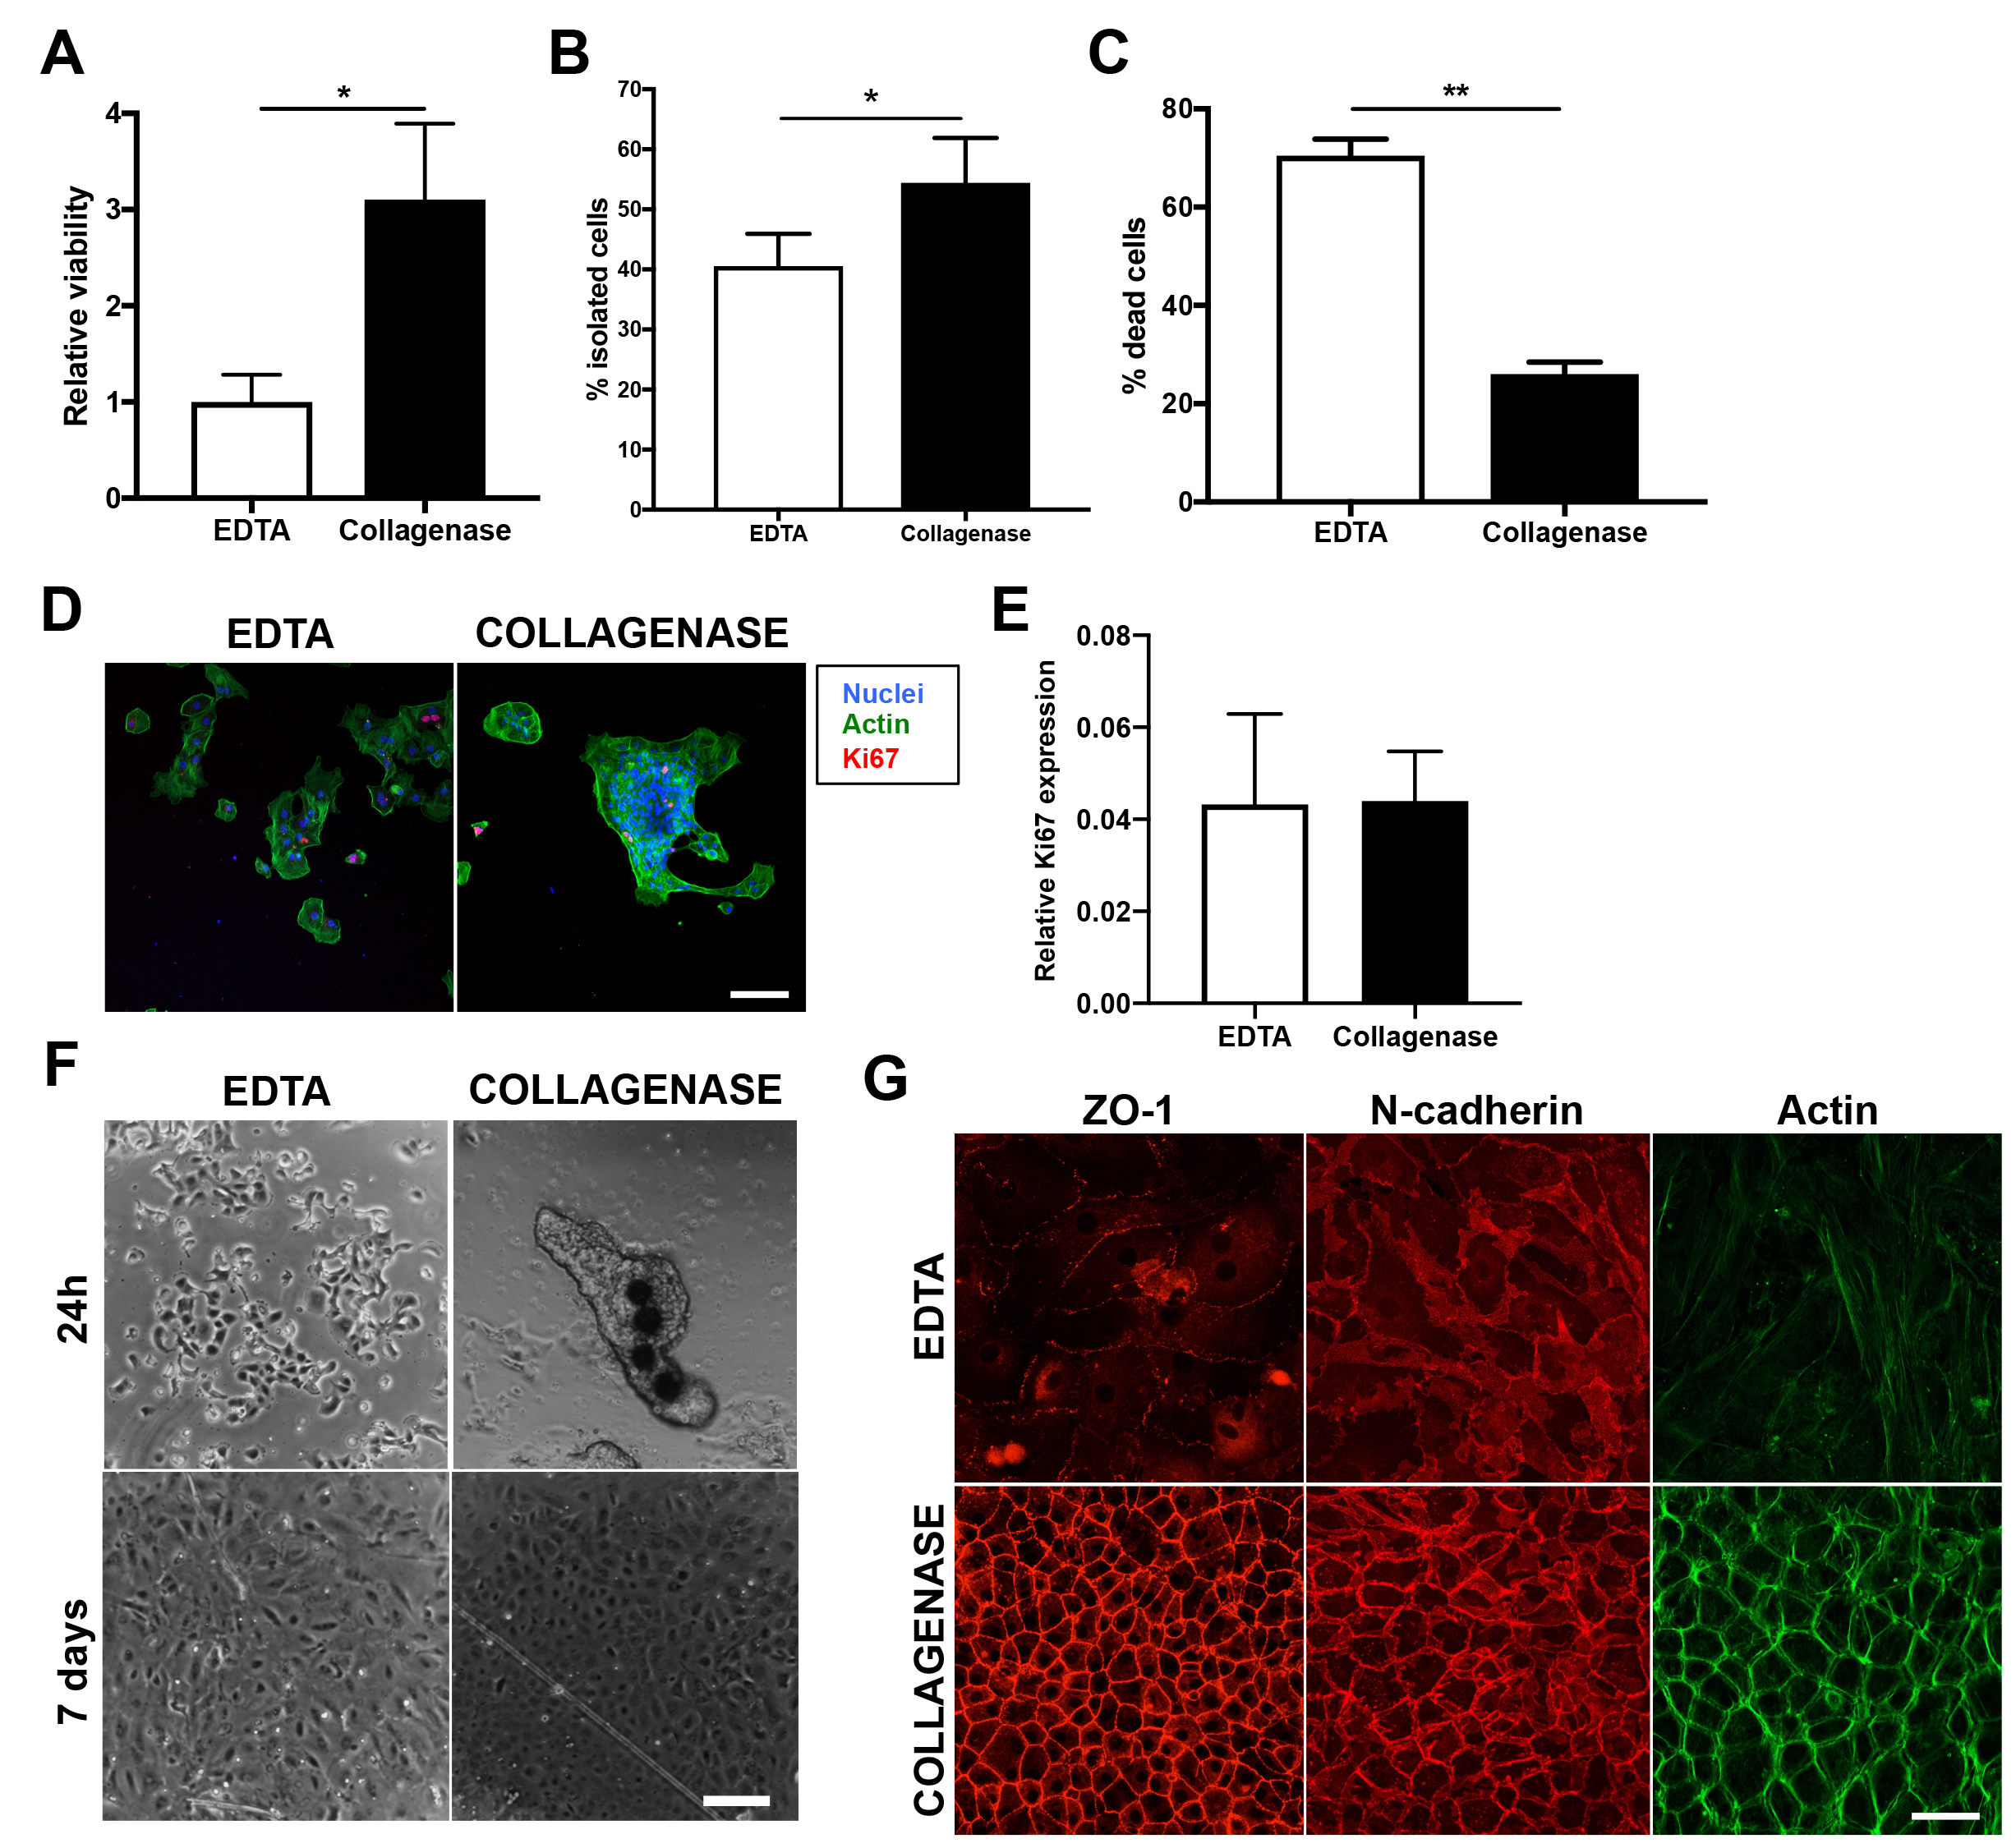
 Figure 1 of
Santerre, Mol Vis 2022; 28:331-339.
Figure 1 of
Santerre, Mol Vis 2022; 28:331-339.