Figure 4. Tertiary structural studies on wild-type and E156K CRYAA. Near-UV CD spectra (A) and tryptophan fluorescence spectra (B) of wild-type (solid curve) and E156K mutant (dashed curve).
The arrows refer to the peaks beyond 260 nm and 277 nm in the wild-type and E156K CRYAA that are different from one another.
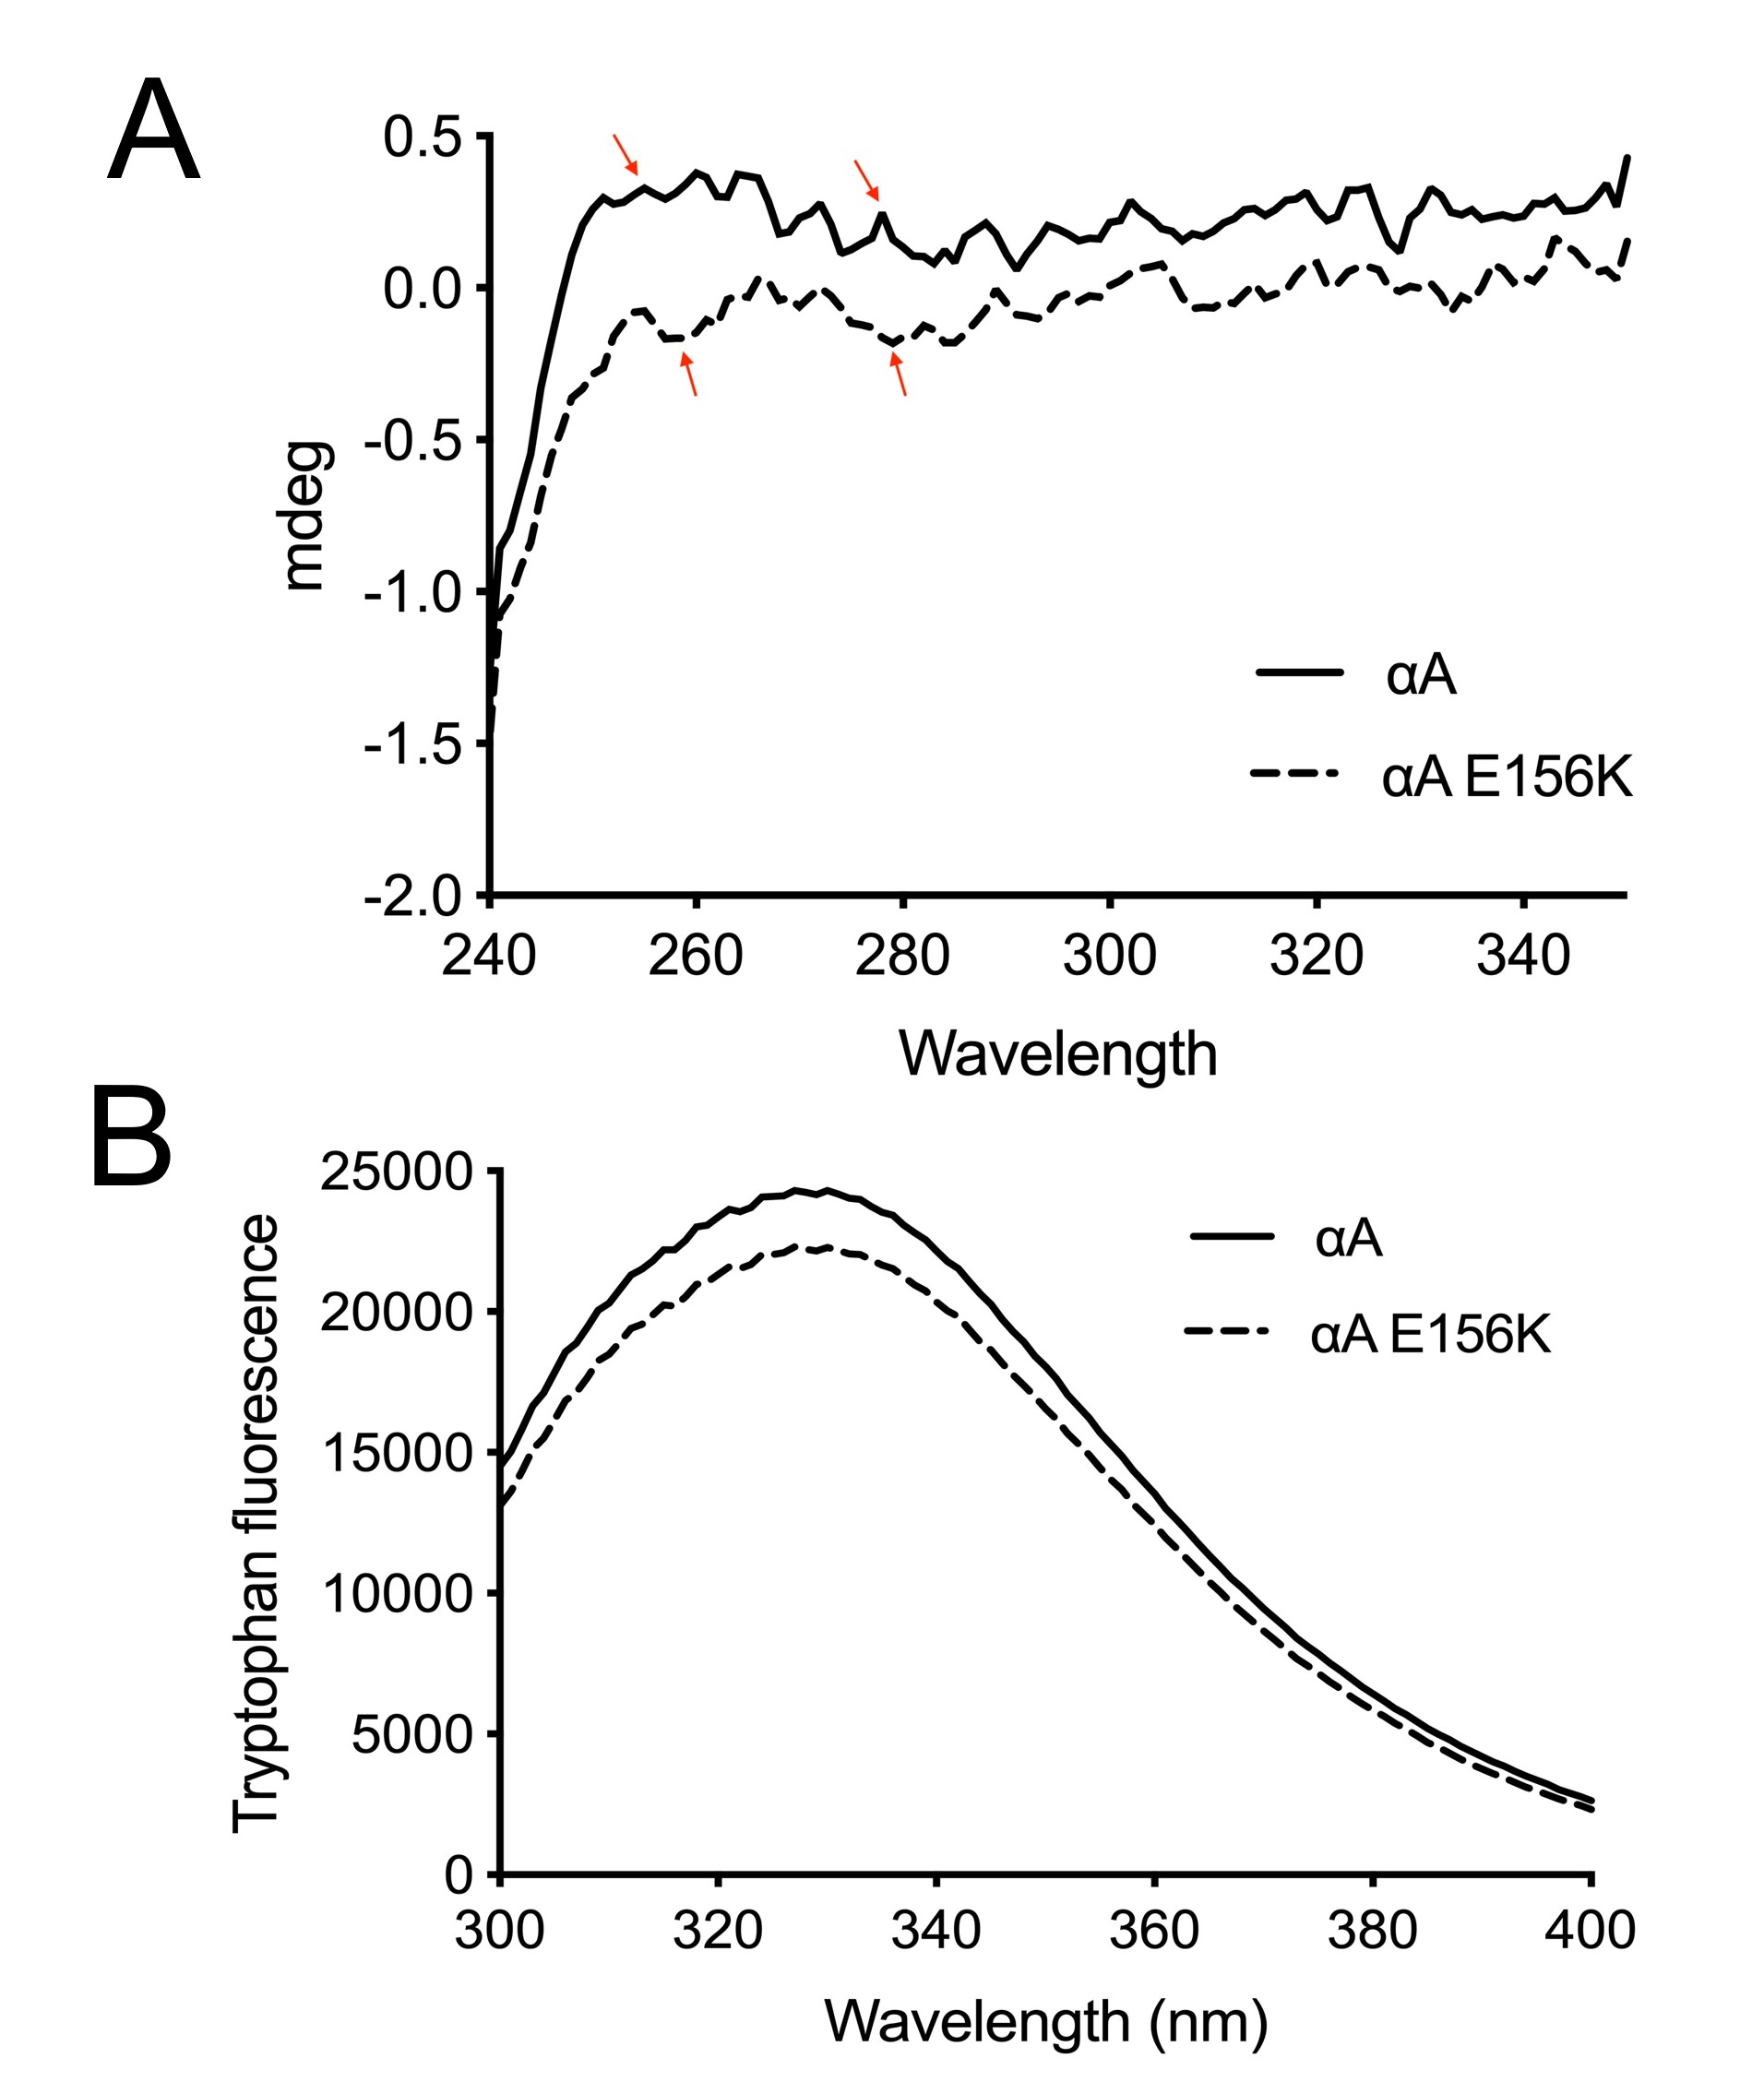
 Figure 4 of
Zhao, Mol Vis 2022; 28:317-330.
Figure 4 of
Zhao, Mol Vis 2022; 28:317-330.