Figure 5. Box plots. Box plots showing A: isolated rod amplitudes (µV) on full-field electroretinography (ffERG) at the initial and follow-up examinations, B: combined rod and cone b-wave amplitudes (µV) on ffERG at the initial and follow-up examinations, and C: combined rod and cone a-wave amplitudes (µV) on ffERG at the initial and follow-up examinations. Boxes show the median and
interquartile range. Bars illustrate the ranges. Circles and asterisks indicate outliers. Sample size: n=11 subjects. The
statistical comparison of the ffERG parameters between the initial and follow-up examinations was made using the Wilcoxon
signed-rank test.
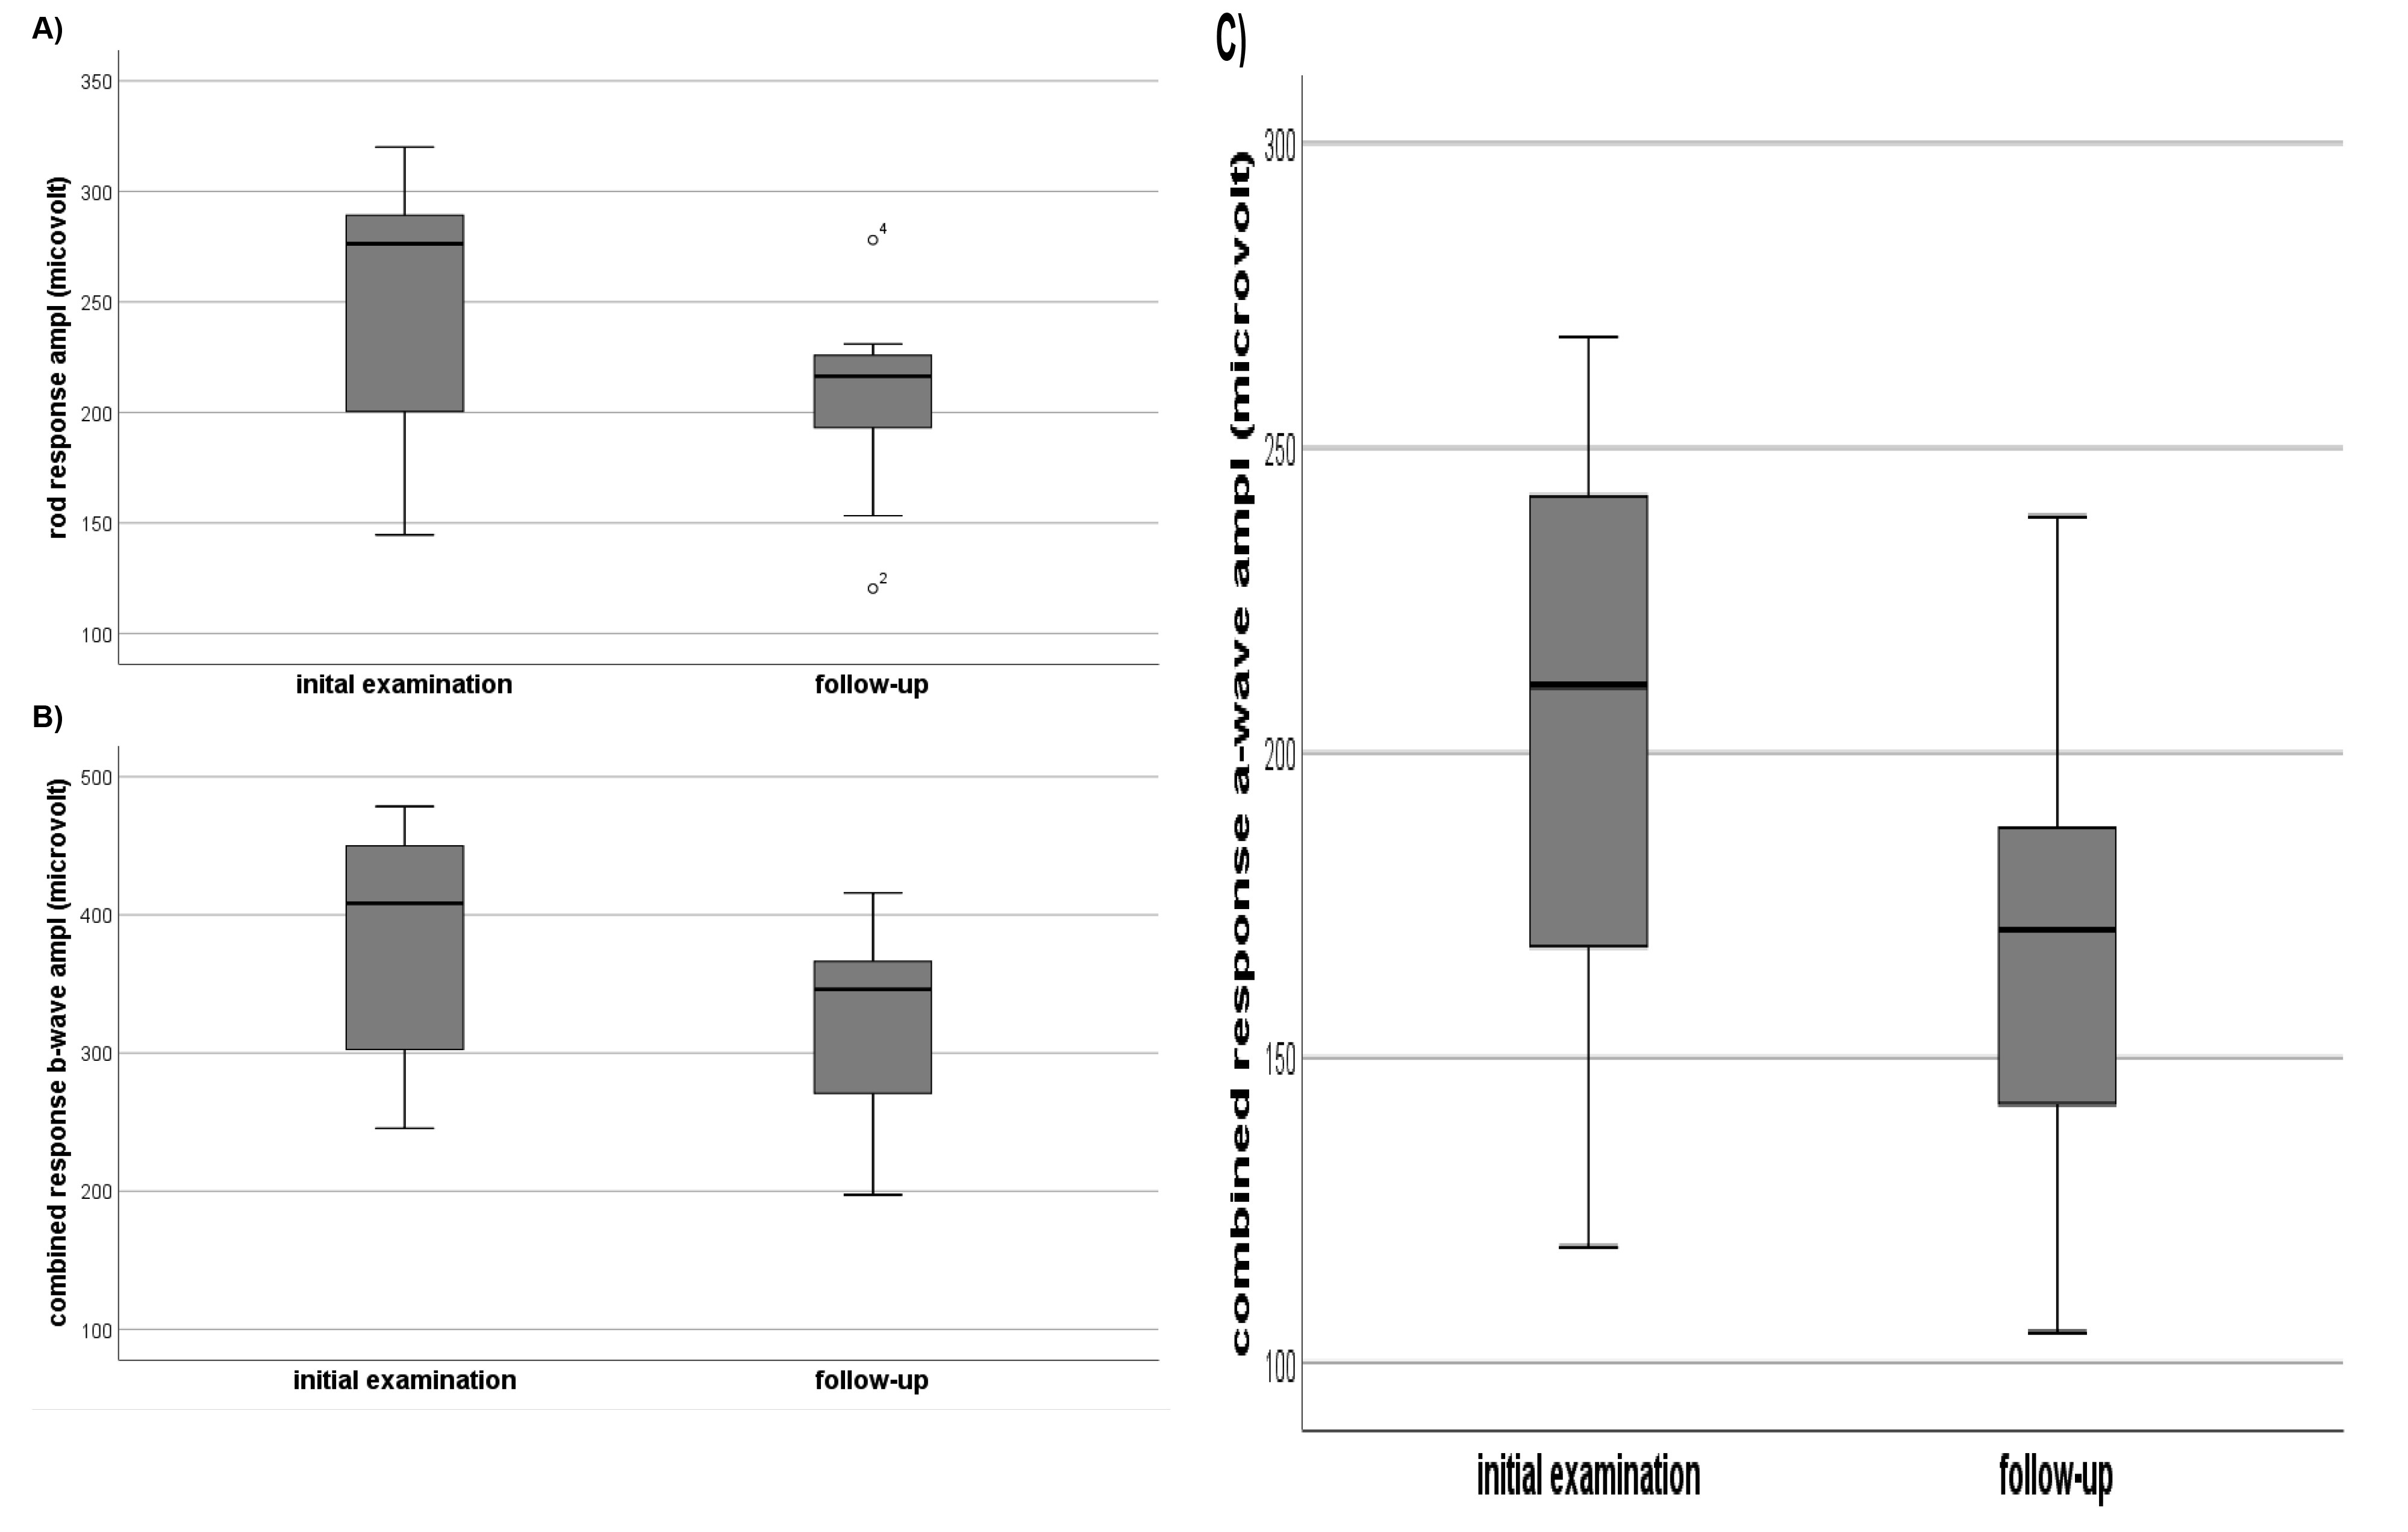
 Figure 5 of
Kjellström, Mol Vis 2022; 28:300-316.
Figure 5 of
Kjellström, Mol Vis 2022; 28:300-316.