Figure 4. Effect of probenecid on Lucifer yellow (LY) uptake in lens exposed to the hypotonic challenge. Images of Texas red-dextran
(TRD; A, C) and LY (B, D) penetration in equatorial sections from the lenses incubated for 1 h in either hypotonic AAH in the absence (A, B) or presence (C, D) of 1 mM probenecid. (E) Normalized TRD signal intensity plotted against distance into the lens taken from the lenses incubated in hypotonic AAH in
the absence (red line) or presence (dashed red line) of 1 mM probenecid isotonic. (F) Normalized LY signal intensities plotted against distance into the lens taken from the lenses incubated in hypotonic AAH
in the absence (green line) or presence (dashed green line) of 1 mM probenecid isotonic. Scale bar = 100 µm.
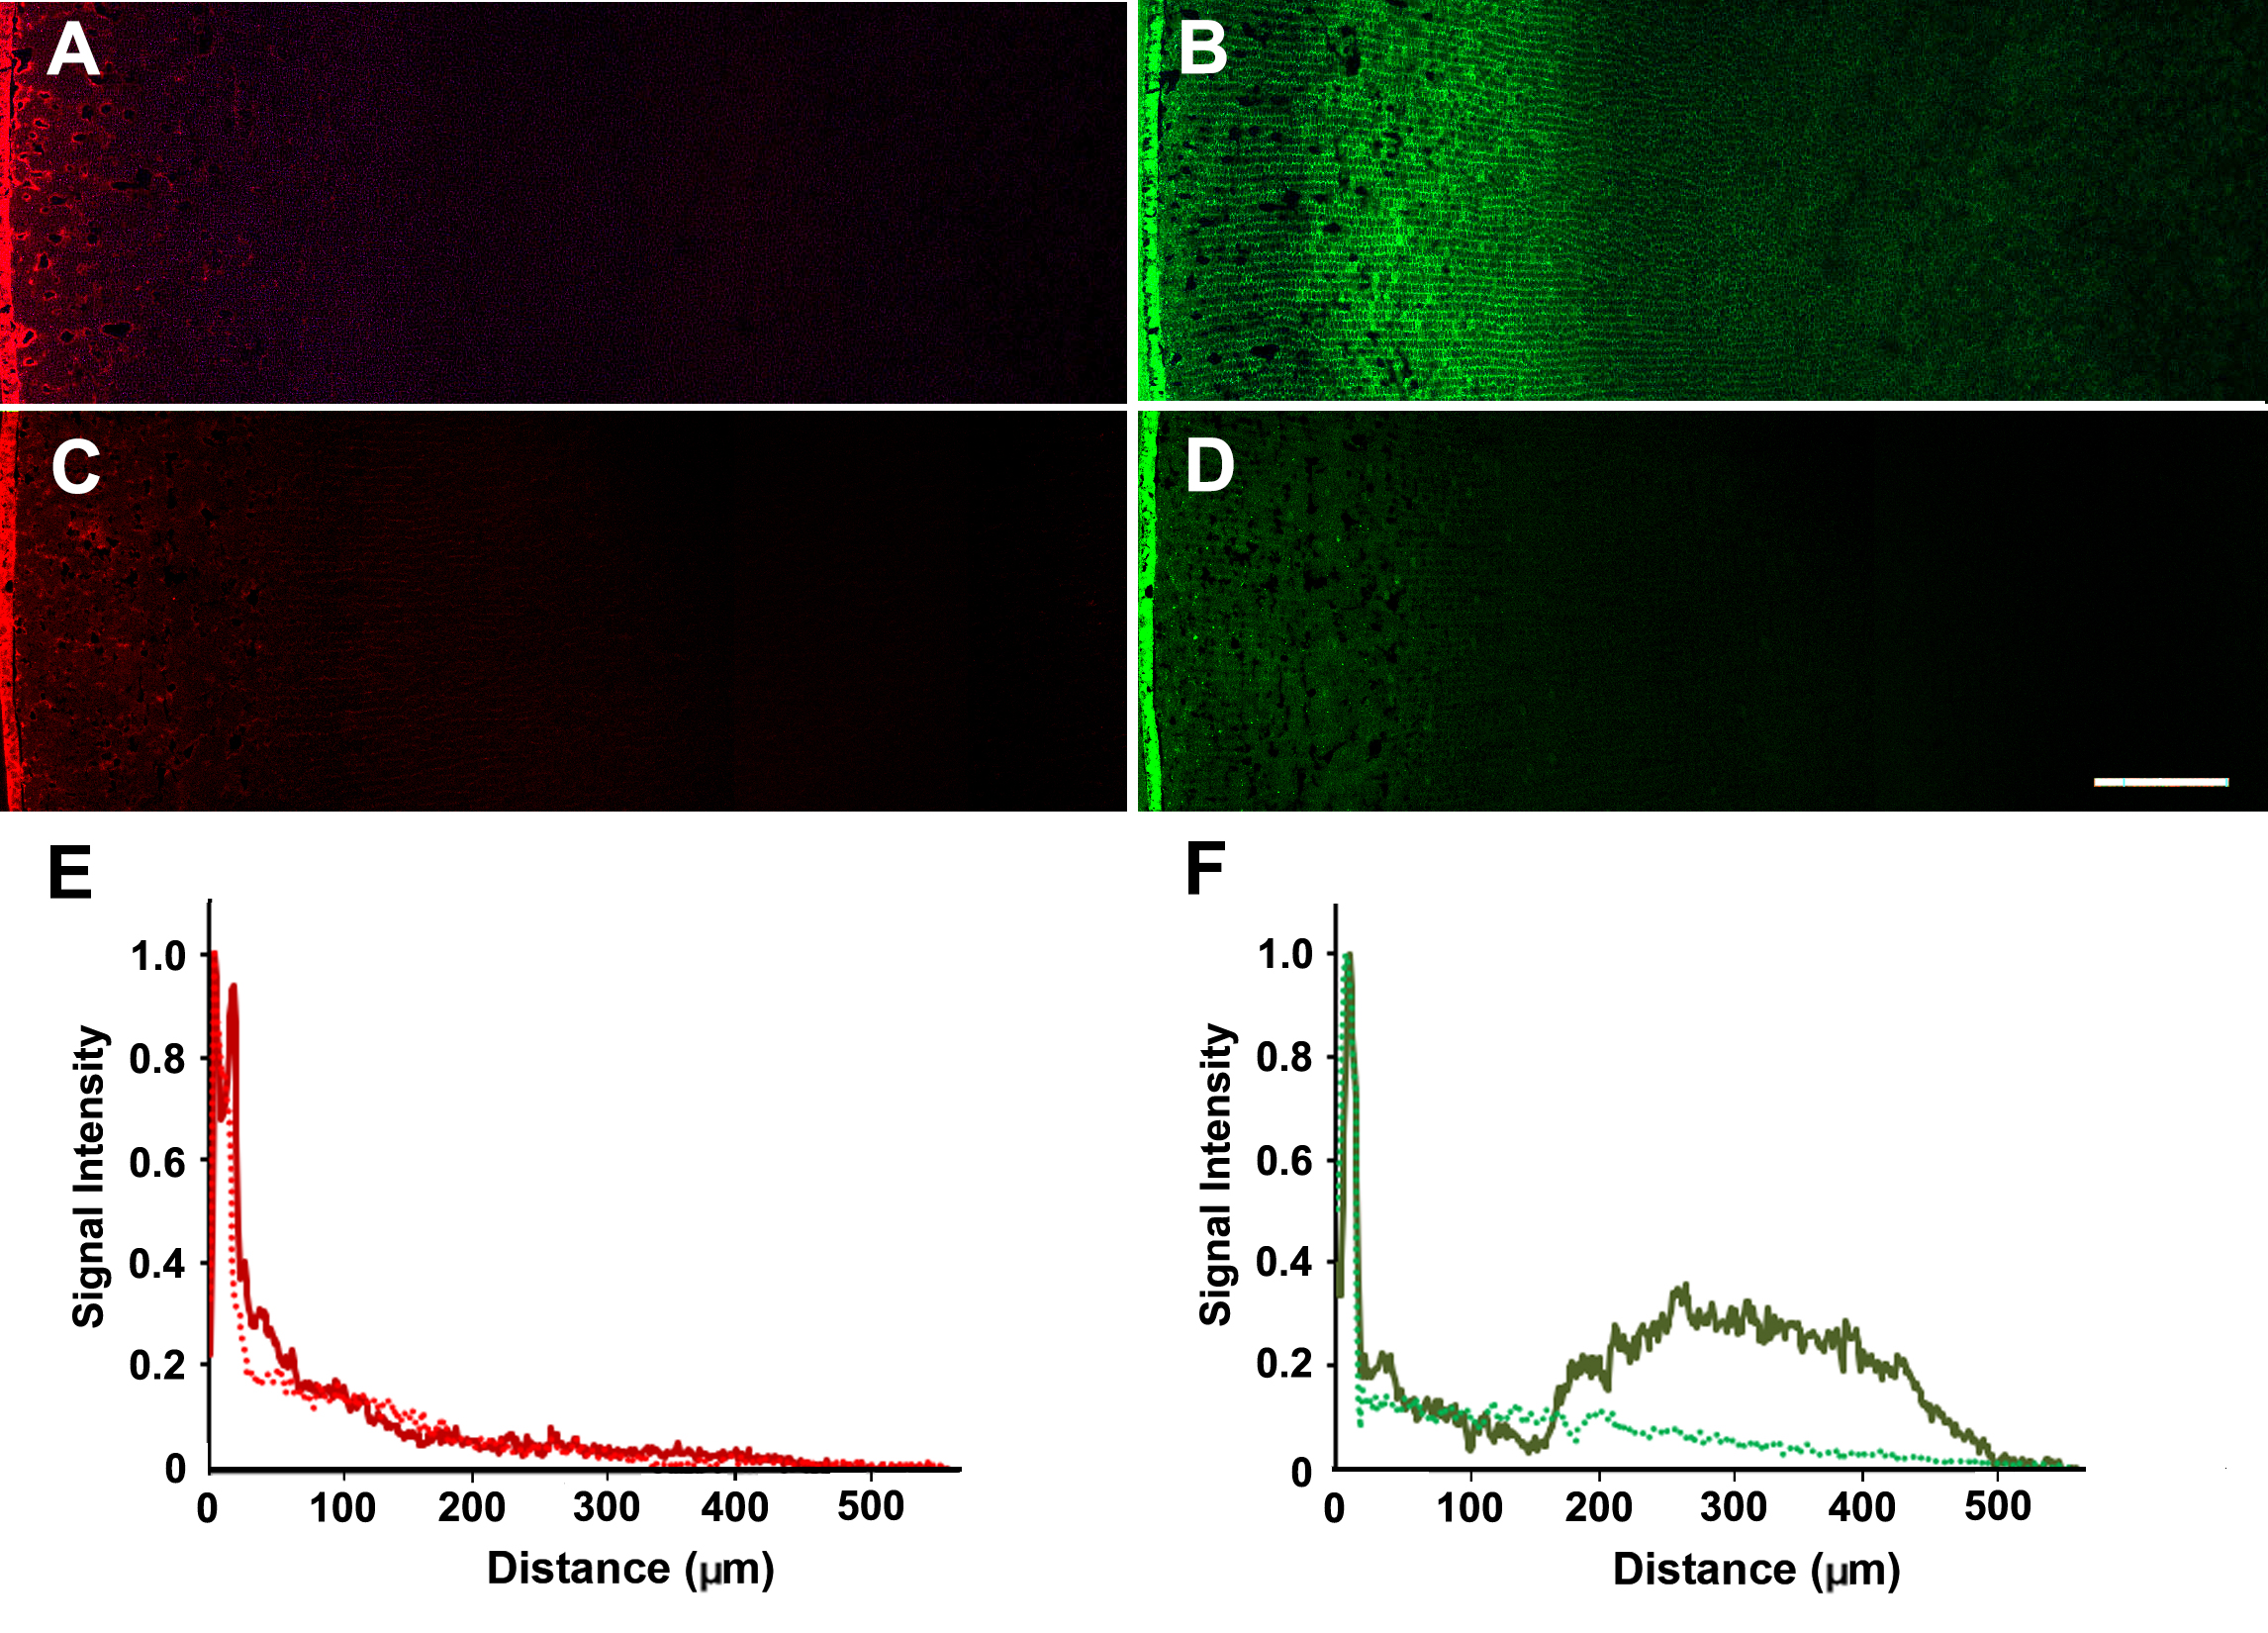
 Figure 4 of
Suzuki-Kerr, Mol Vis 2022; 28:245-256.
Figure 4 of
Suzuki-Kerr, Mol Vis 2022; 28:245-256.