Figure 2. Hypotonicity induces ATP release from rat lenses in the lens cortex. A-B: Time course of ATP release into the media measured from the rat lenses incubated in either isotonic (300±5 mOsm black),
hypertonic (420±5 mOsm brown), or hypotonic (175±5 mOsm blue) AAH for 1 h. The error bars represent the standard error of
the mean, and “()” represents the number of lenses in each experimental group. *p < 0.01. C-J: Images of Texas red-dextran (TRD; C, D, G, H) and Lucifer yellow (LY; E, F, I, J) penetration in axial sections from the lenses incubated for 1 h in either isotonic (C, E, G, I) or hypotonic (D, F, H, J) AAH showing dye penetration orientation at the equator (C-F, top panels) and the anterior pole (G-J, bottom panels). (K) Normalized LY signal intensity plotted against distance into the lens taken from the lenses incubated in isotonic (green
line) or hypotonic (dashed green line) AAH showing an area (***) of LY uptake induced by the hypotonic challenge. (L) Normalized LY (dashed green line) and TRD (red line) signal intensities plotted against distance into the lens taken from
the lenses incubated in hypotonic AAH. Scale bar = 50 µm.
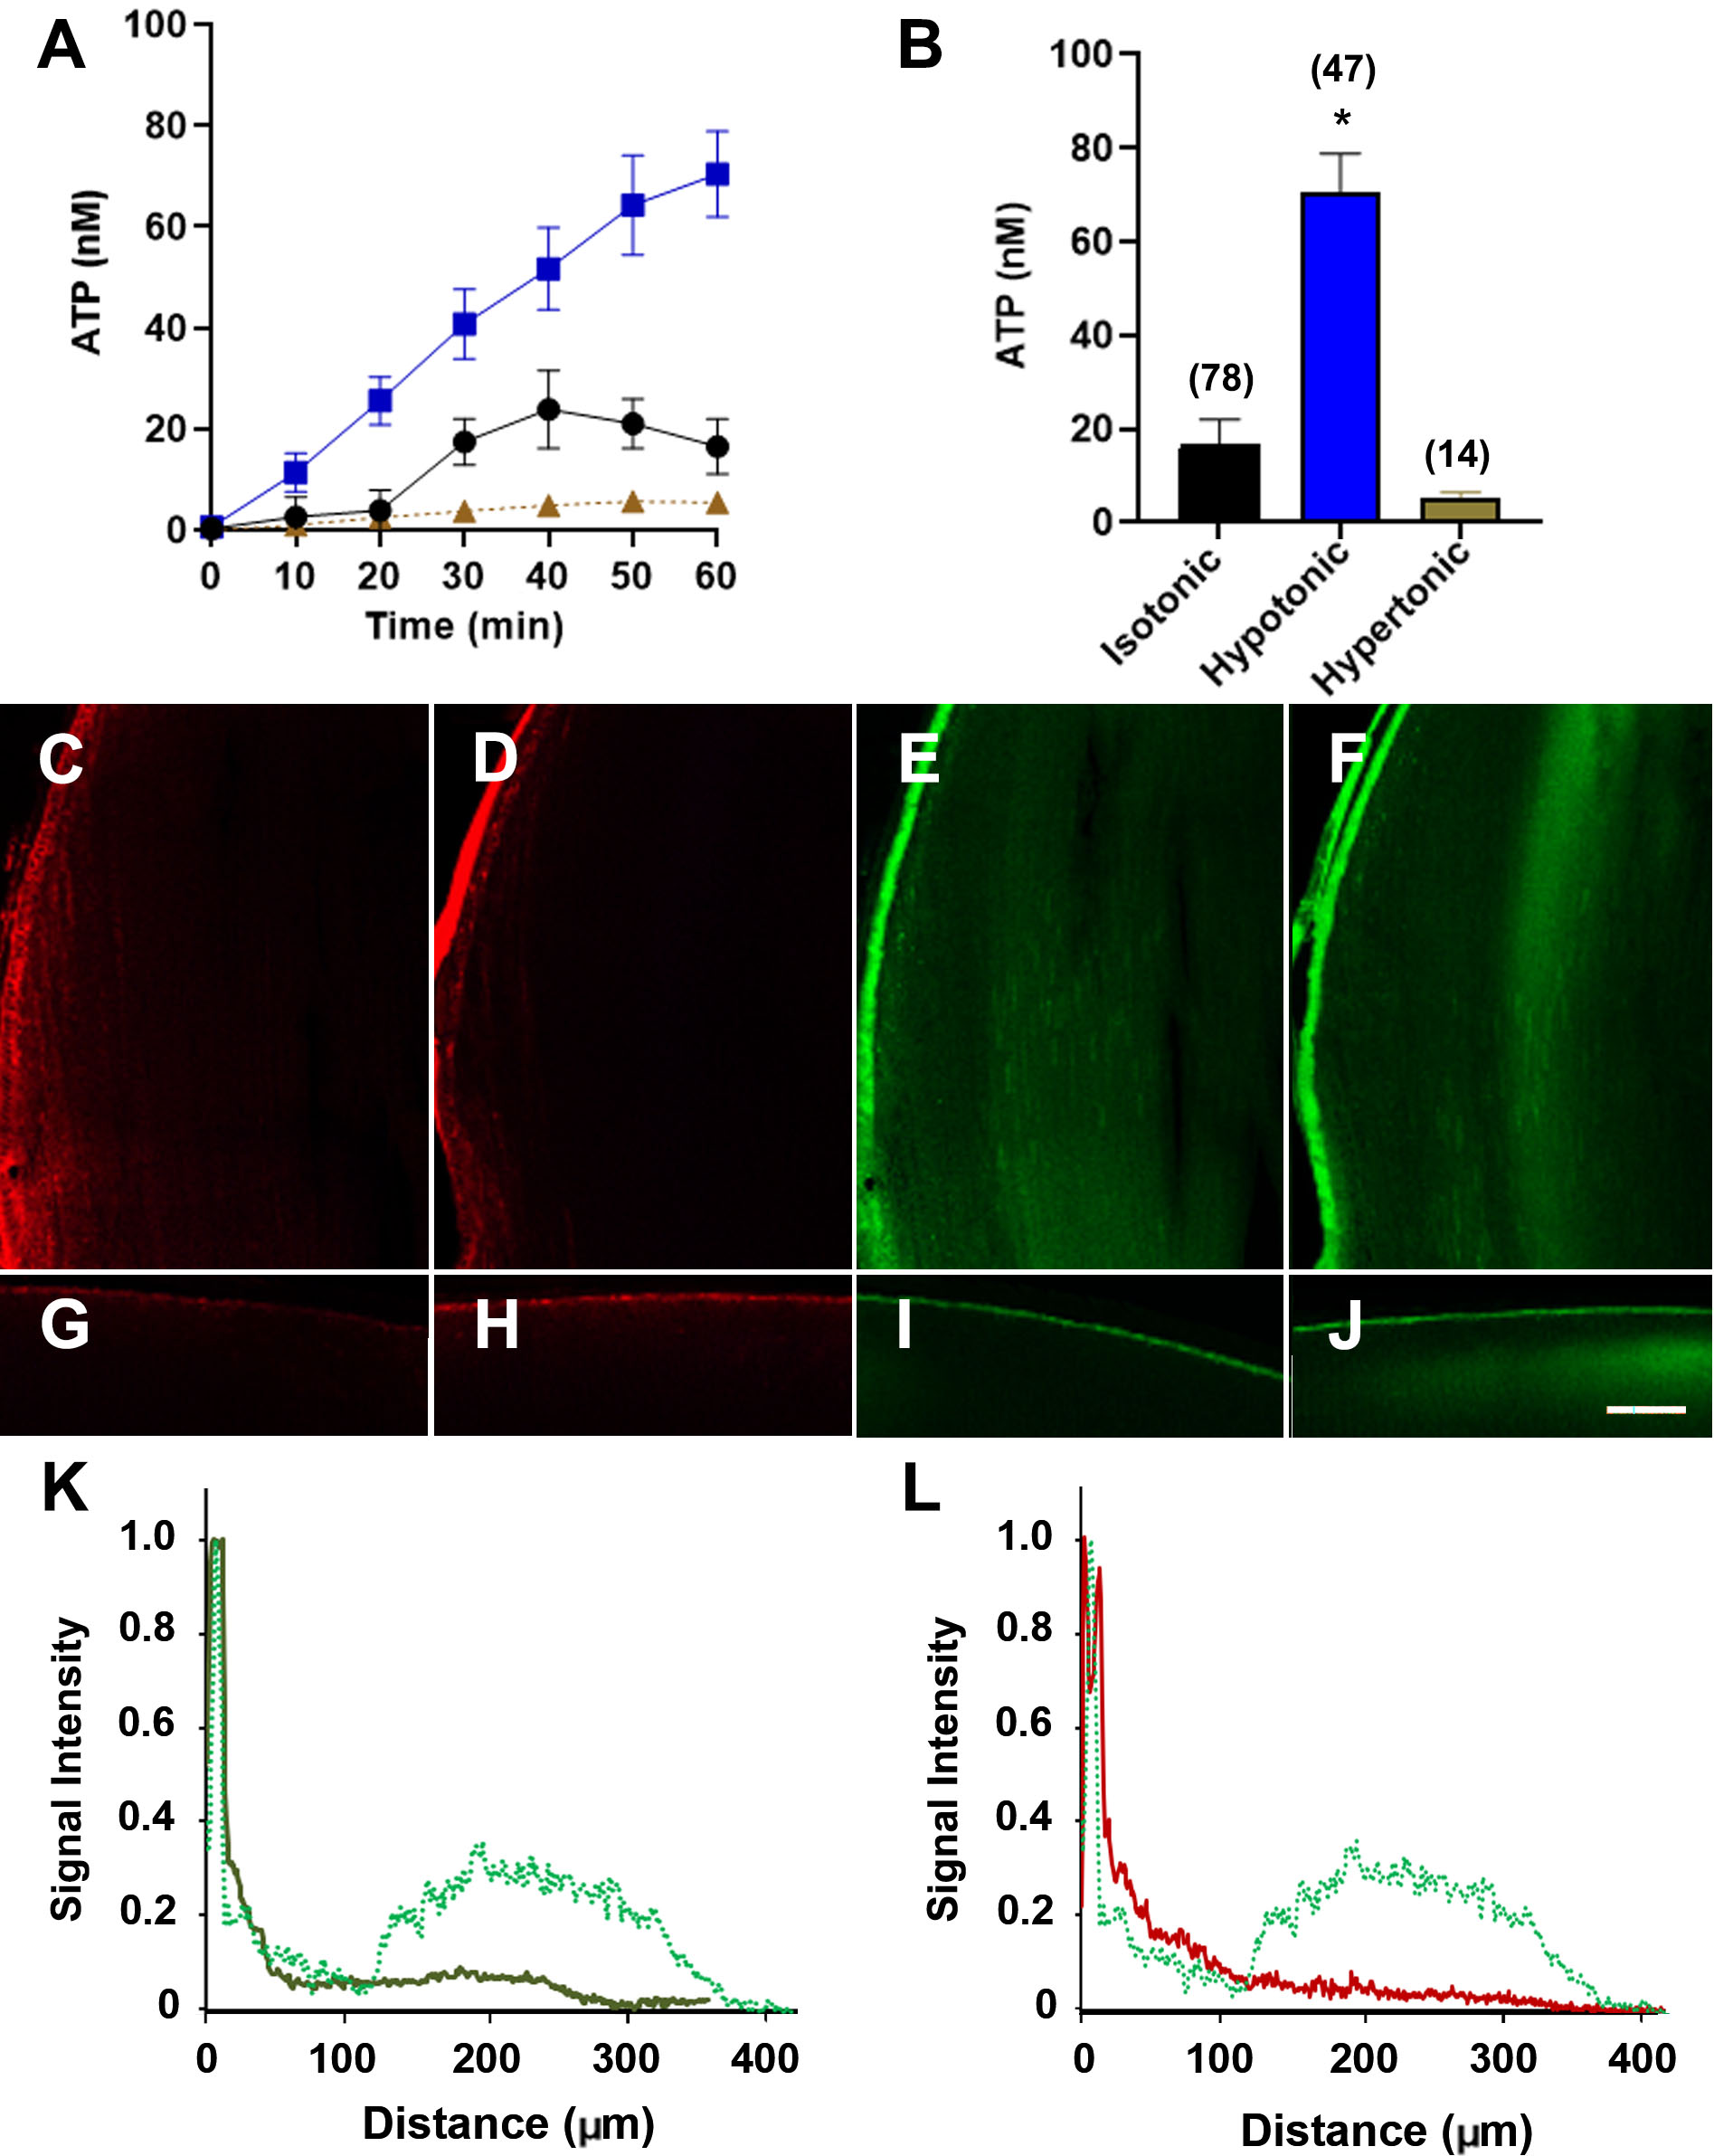
 Figure 2 of
Suzuki-Kerr, Mol Vis 2022; 28:245-256.
Figure 2 of
Suzuki-Kerr, Mol Vis 2022; 28:245-256.