Figure 2. Superficial vascular complex (SVC) and deep vascular complex (DVC) of optical coherence tomography angiography (OCT-A)
with corresponding B scan by diabetic retinopathy (DR) diagnosis. A-D: Indicate the SVC using 6 × 6 mm OCT-A images
centered on the fovea in representative patients with increasing levels of DR severity. E-H: Show the DVC of the
same eye with the same dimensions and DR. I-L: The color-coated map of the SVC area illustrates the study finding that
the whole and parafoveal VD of the SVC decreased with increasing DR severity. M-P: Show the corresponding B scans for
each level of DR severity with no evidence of macular edema.
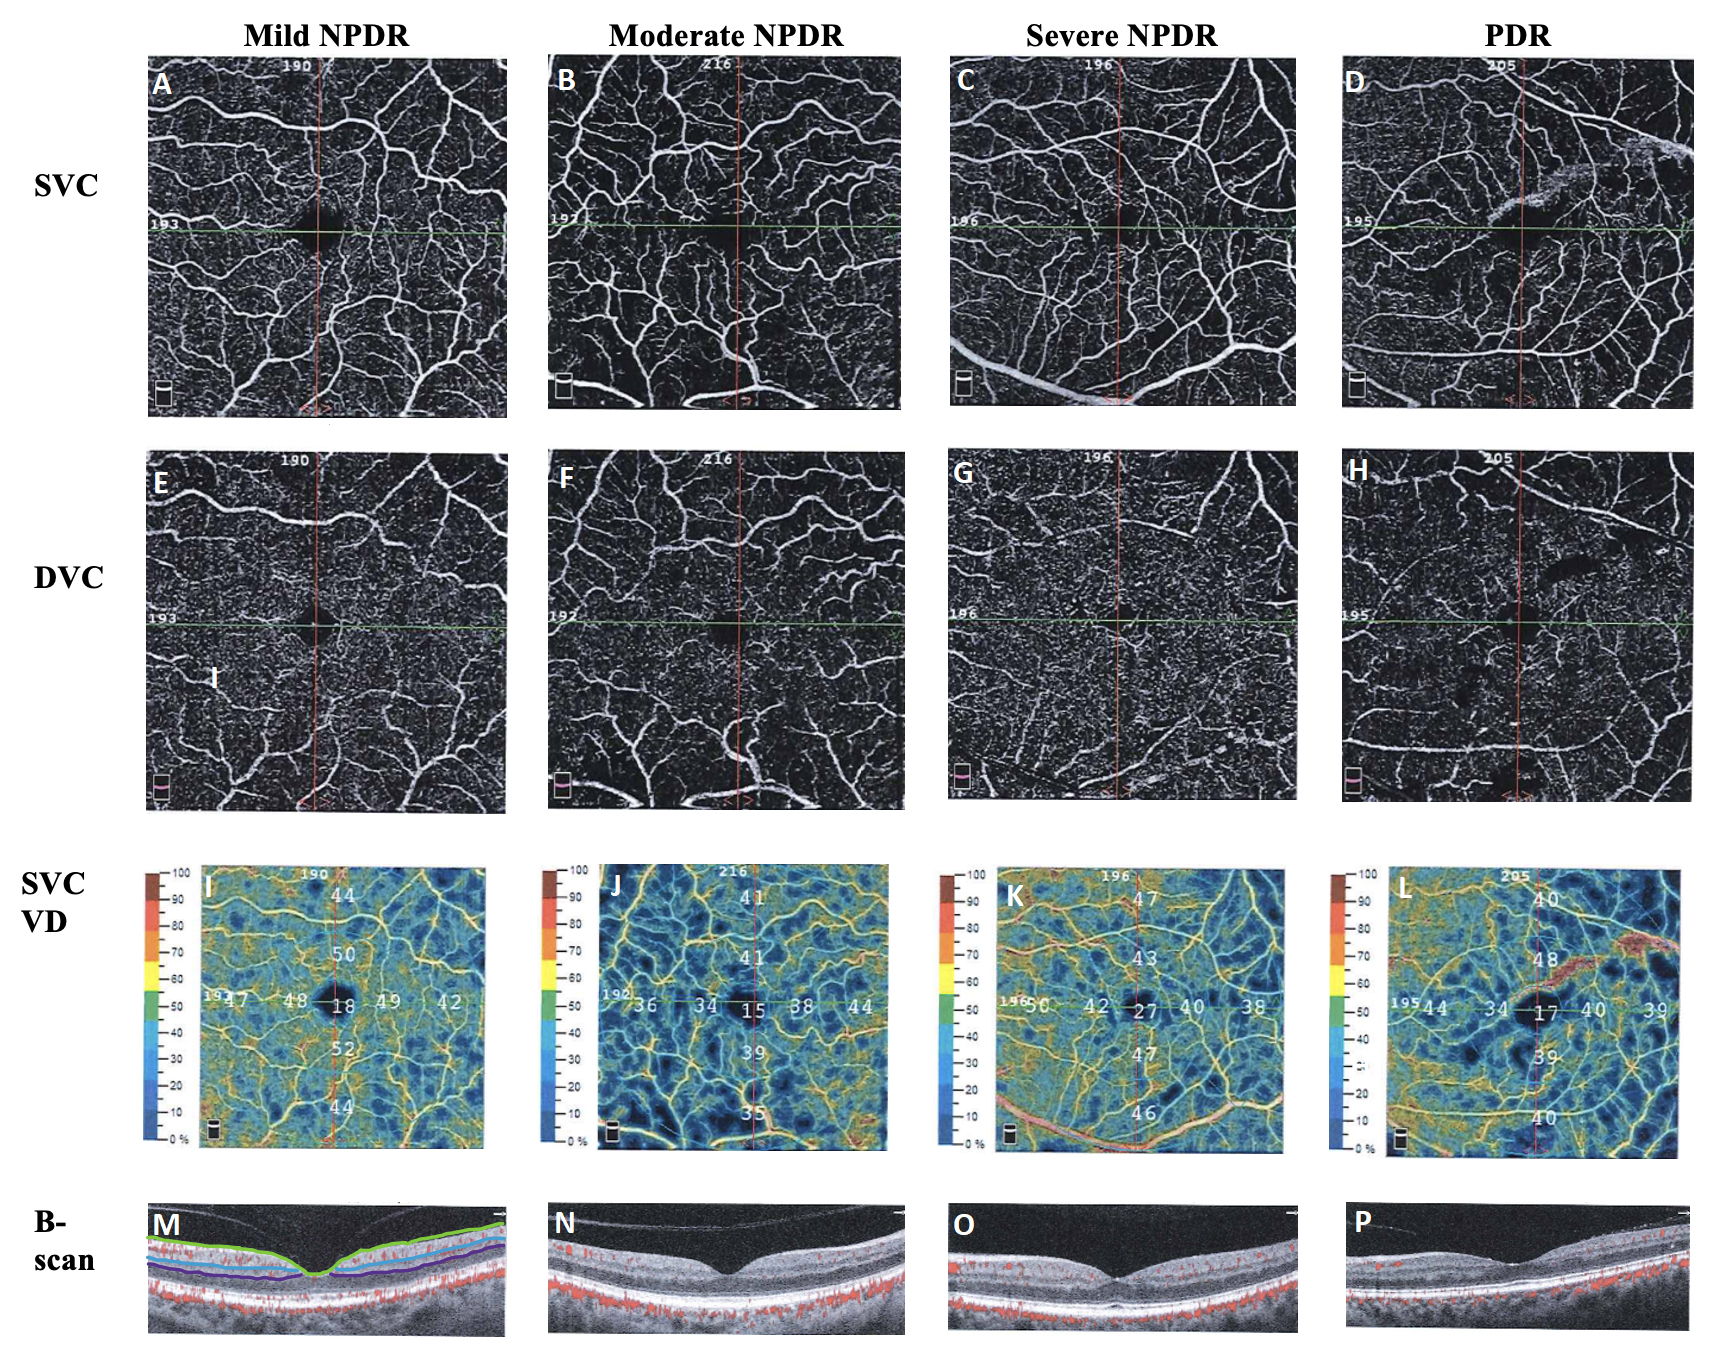
 Figure 2 of
Scheive, Mol Vis 2022; 28:220-229.
Figure 2 of
Scheive, Mol Vis 2022; 28:220-229.