Figure 4. Analysis of DCT promoter activities using dual-luciferase assay. The activity of -657 to +411 and -272 to +411 DCT promoters was compared to CMV promoter activity in Y79 (A), ARPE-19 (B), NCI-H1975 (C), and HCT15 (D) cell lines. The bar graphs show the means and standard deviations for three independent experiments for Y79 and ARPE-19
cell lines.
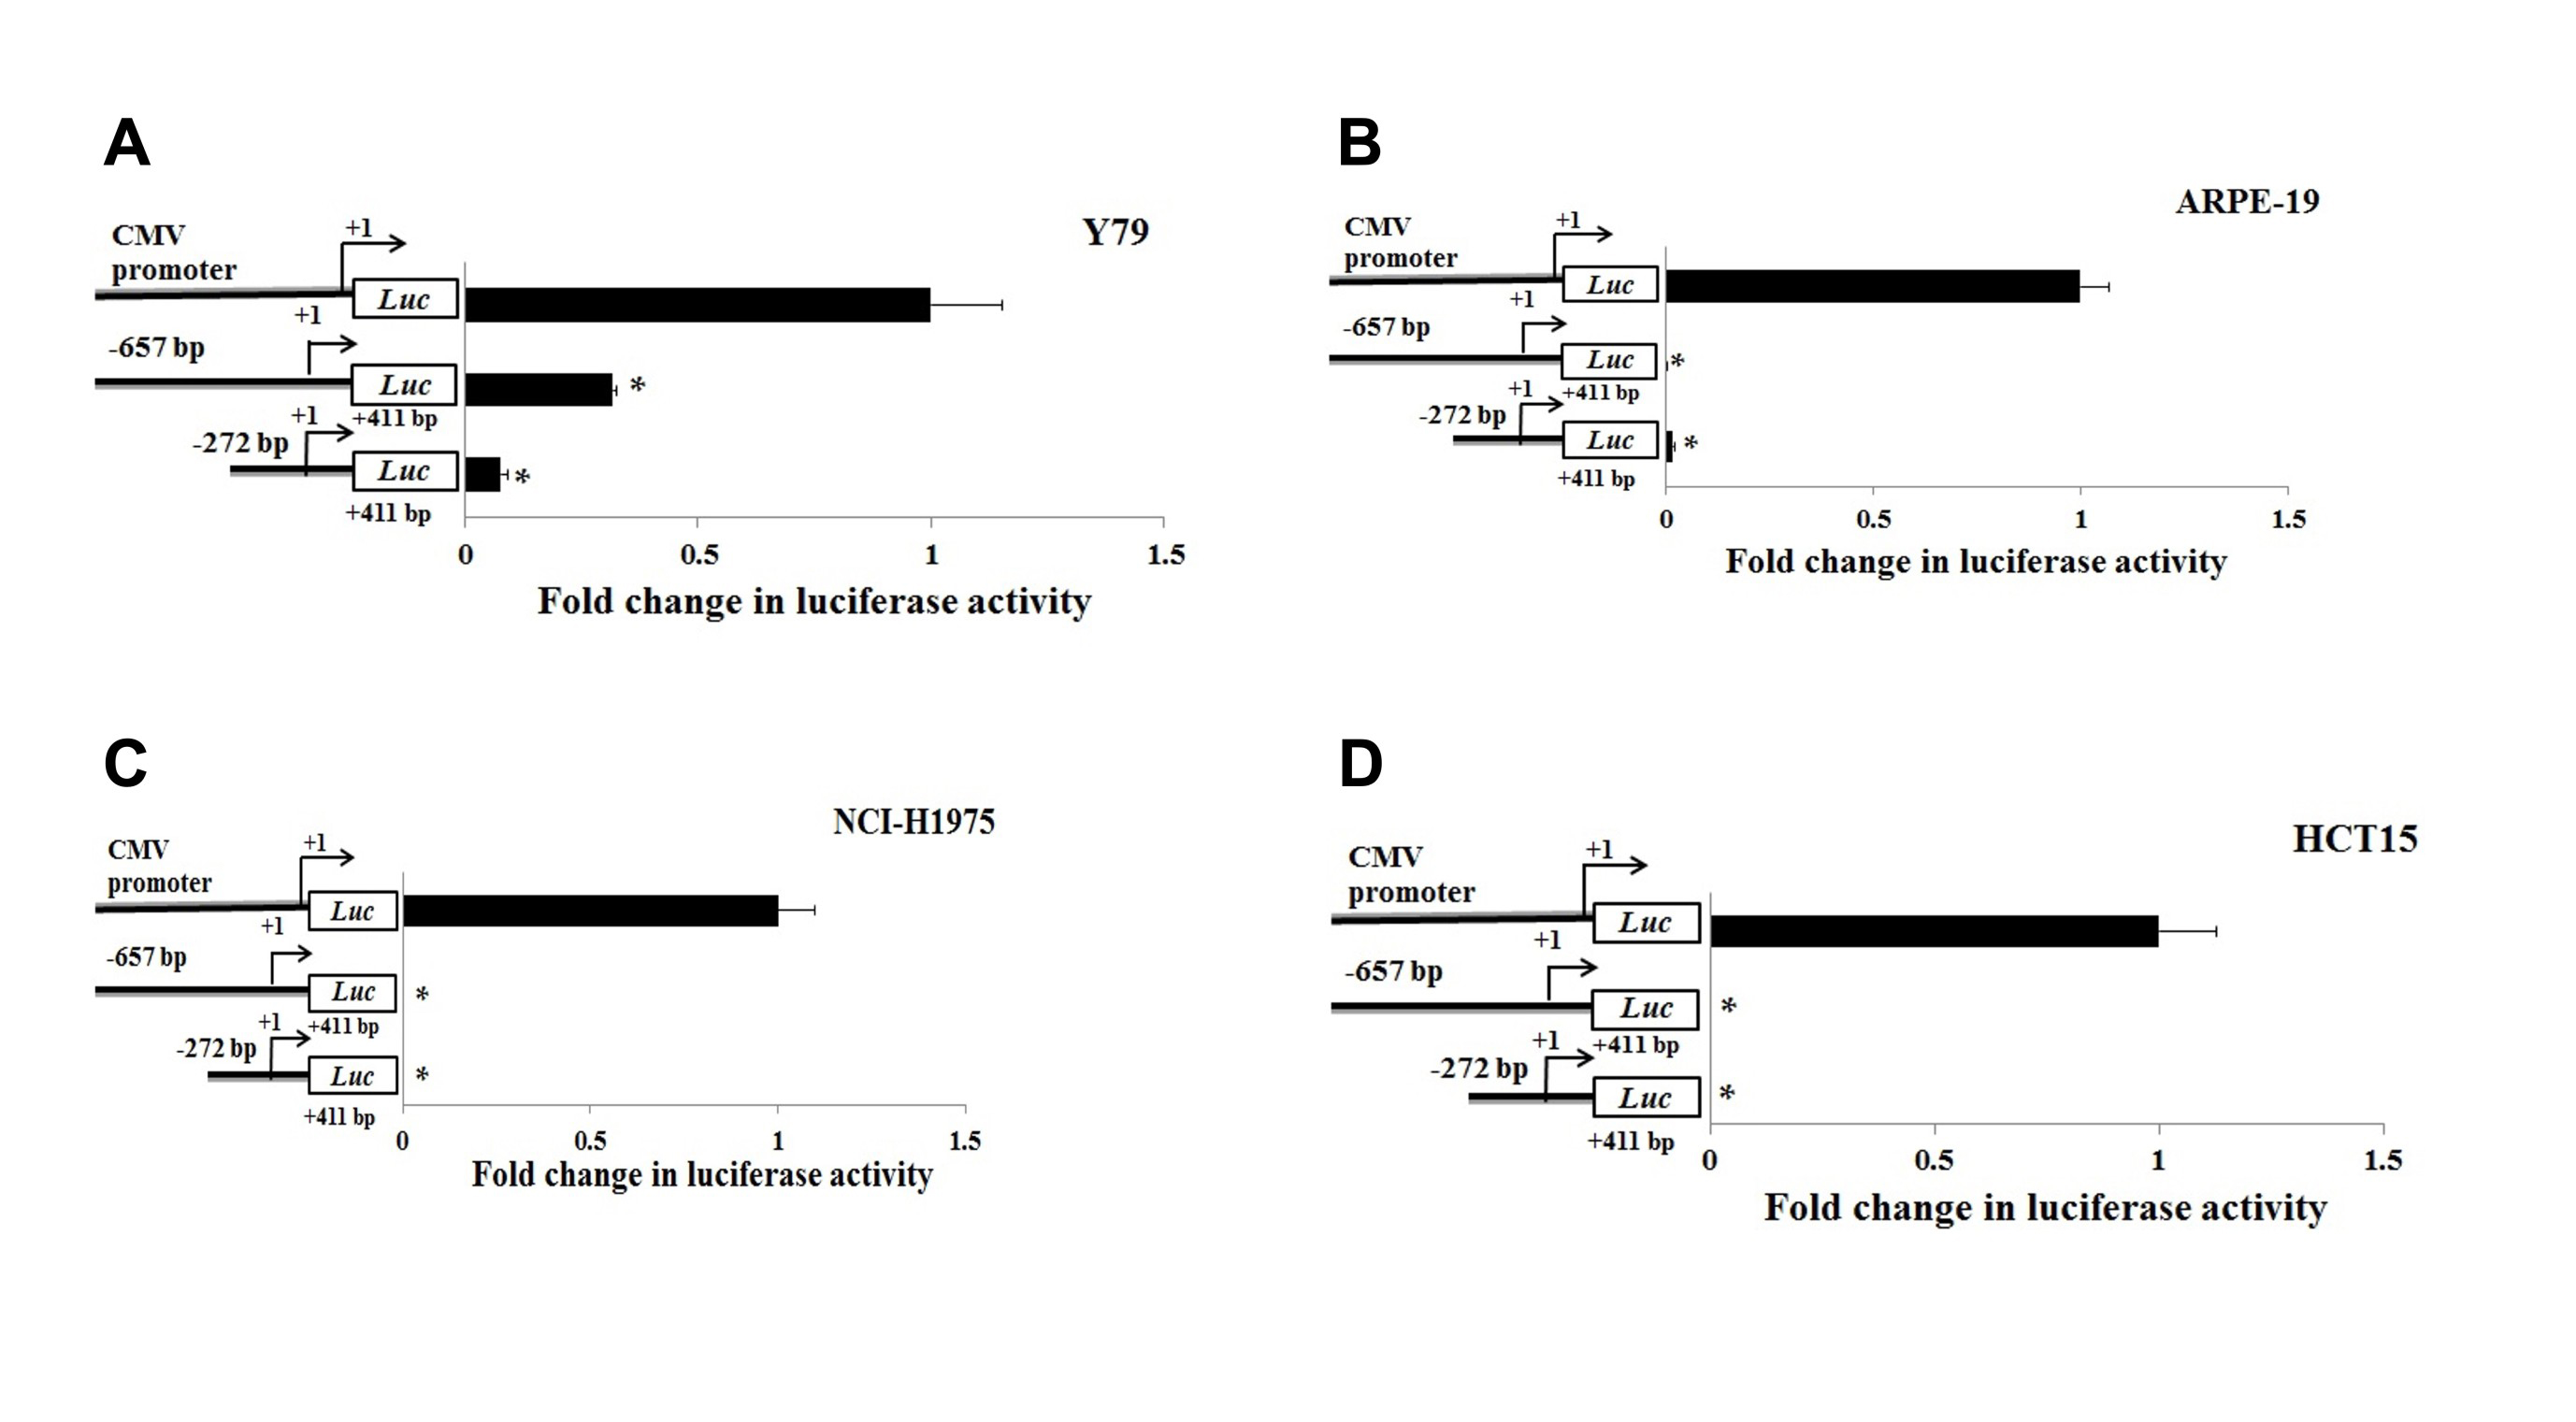
 Figure 4 of
Moolsuwan, Mol Vis 2022; 28:192-201.
Figure 4 of
Moolsuwan, Mol Vis 2022; 28:192-201.