Figure 3. DCT gene expression in retinoblastoma (RB) tissues, normal retinas, ocular cells, and other tissues. A: DCT expression normalized to 18s rRNA in 13 Thai RB tissues. The quantitative polymerase chain reaction (qRT)-PCR results are shown as relative expression compared
to DCT expression in Y79 cells. B: DCT and 18s rRNA expression in two retinas and two RB tissues from the same patients. The PCR products were demonstrated with gel electrophoresis.
C: DCT expression in nine normal human ocular cells. The qRT-PCR results are shown as relative expression compared to DCT expression in Y79 cells. D: Expression of DCT in normal tissues from the GTEx database. E: Relative DCT expression in normal tissues in relation to 16 upregulated genes with medium expression levels in RB.
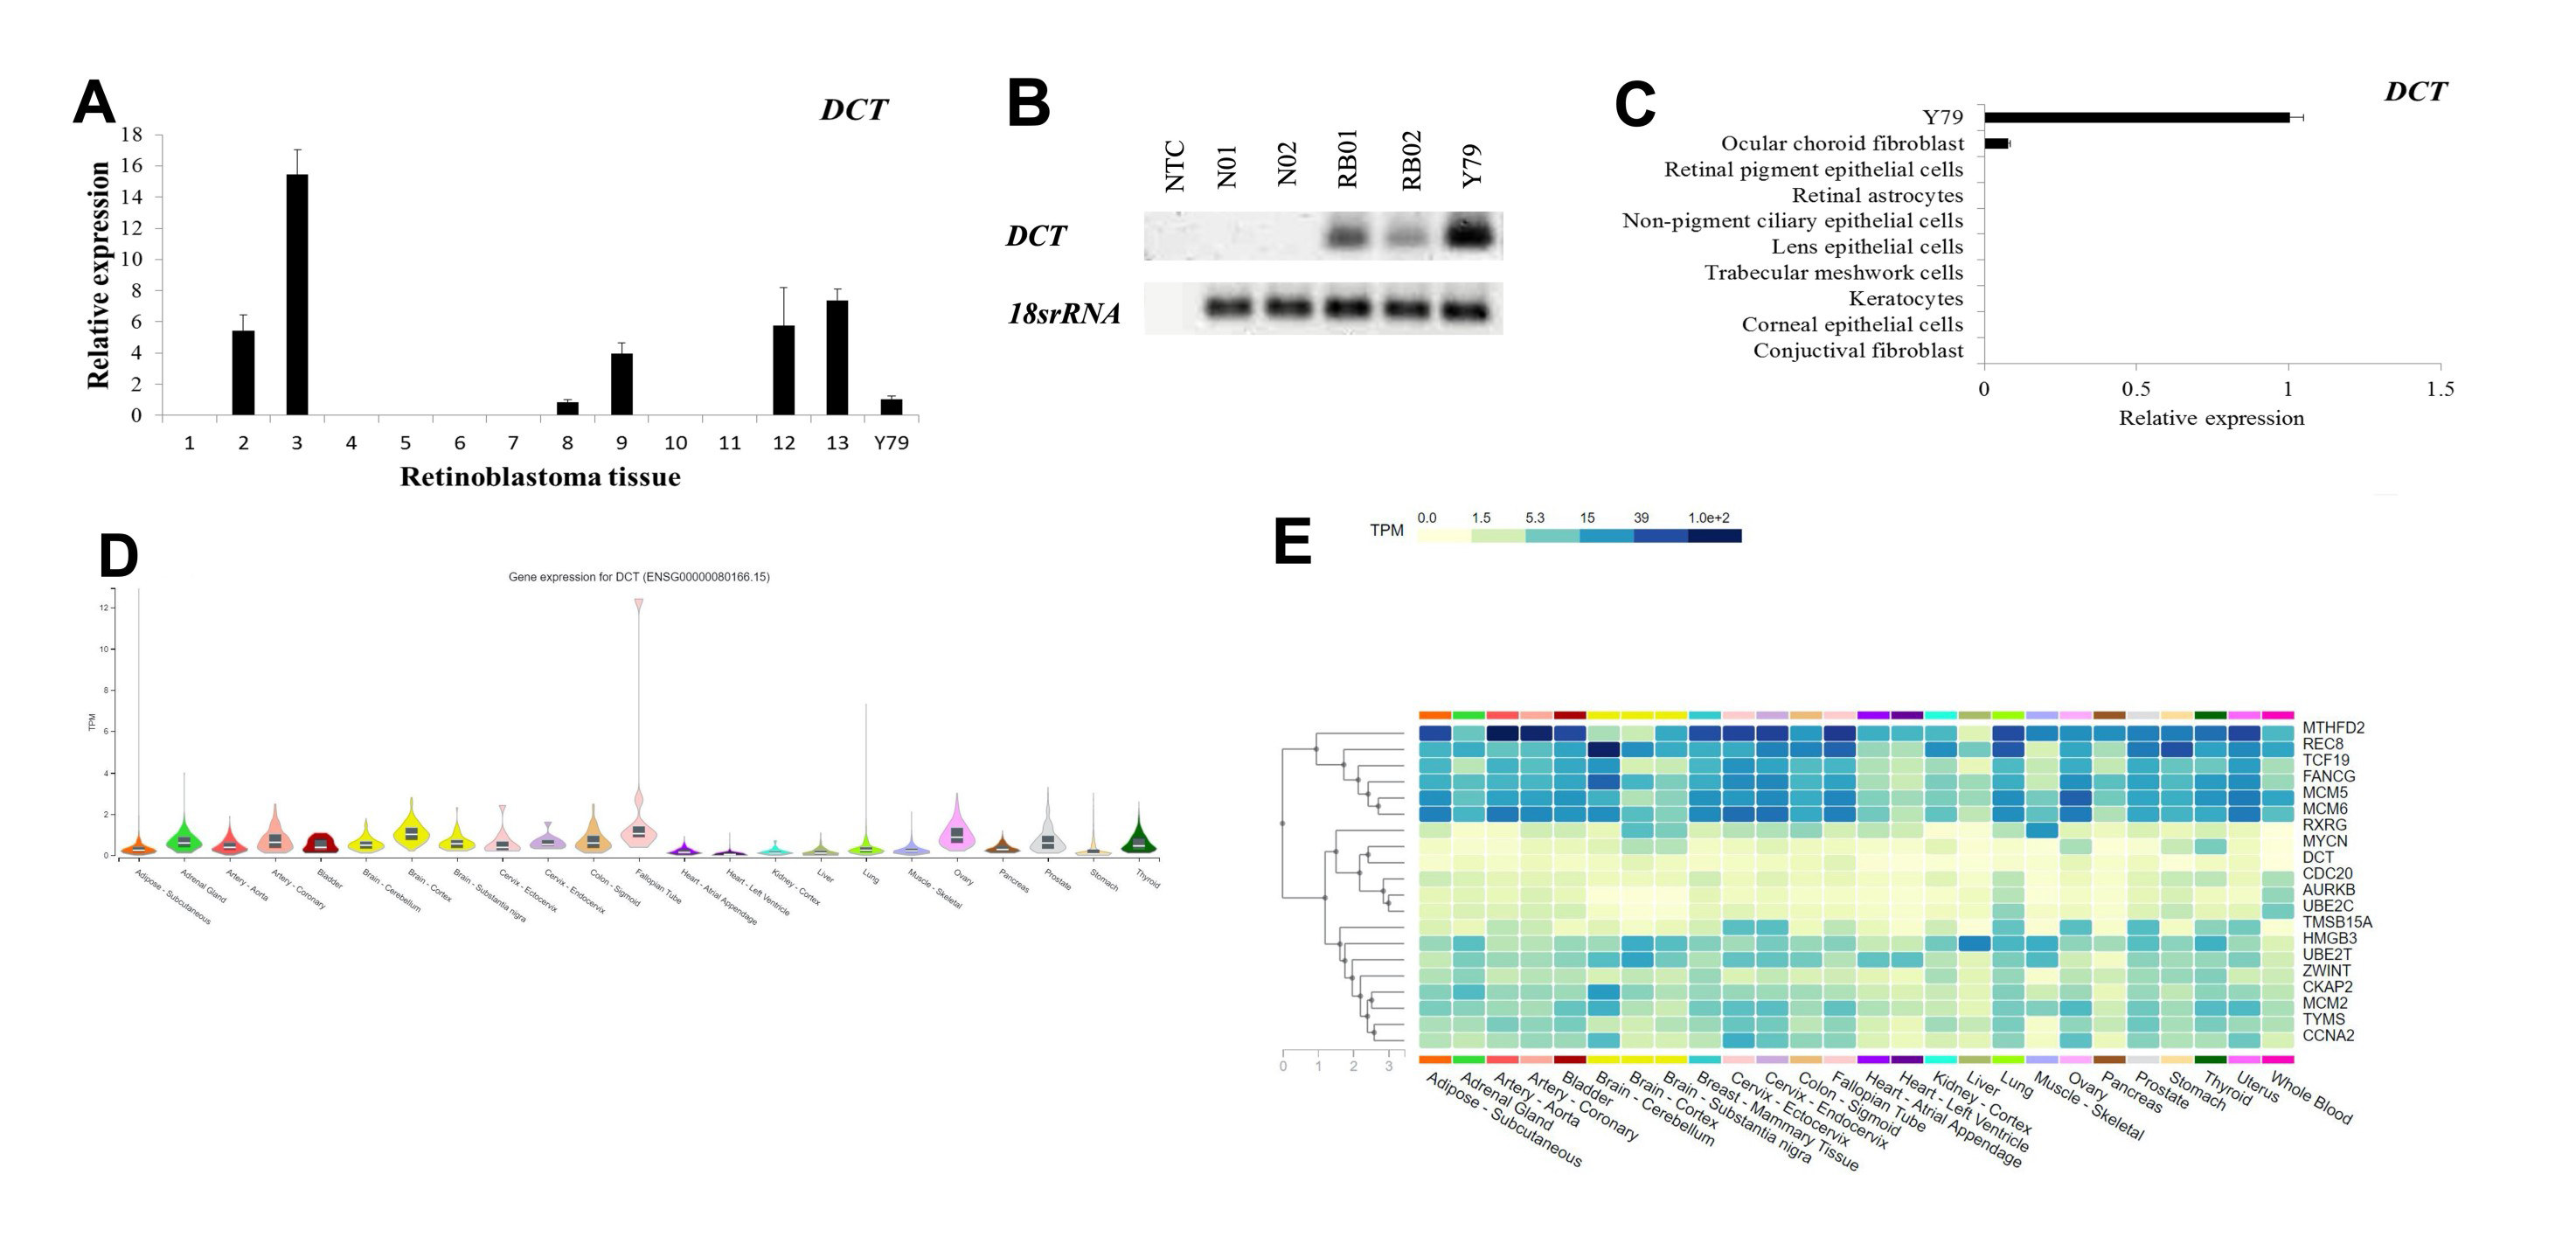
 Figure 3 of
Moolsuwan, Mol Vis 2022; 28:192-201.
Figure 3 of
Moolsuwan, Mol Vis 2022; 28:192-201.