Figure 1. Overlap of gene sets and GO enrichment analysis. A: Venn diagram showing overlap in the number of genes identified as upregulated genes in RB from 3 microarray and reanalyzed
RNA-seq data. B: Gene/Gene Set Overlap Matrix of 116 commonly upregulated genes. Overlaps between the list of 116 commonly upregulated genes
and the top 10 most significantly enriched Gene Ontology terms (FDR q-value less than 0.05) was demonstrated using Gene Set
Enrichment Analysis (GSEA) software.
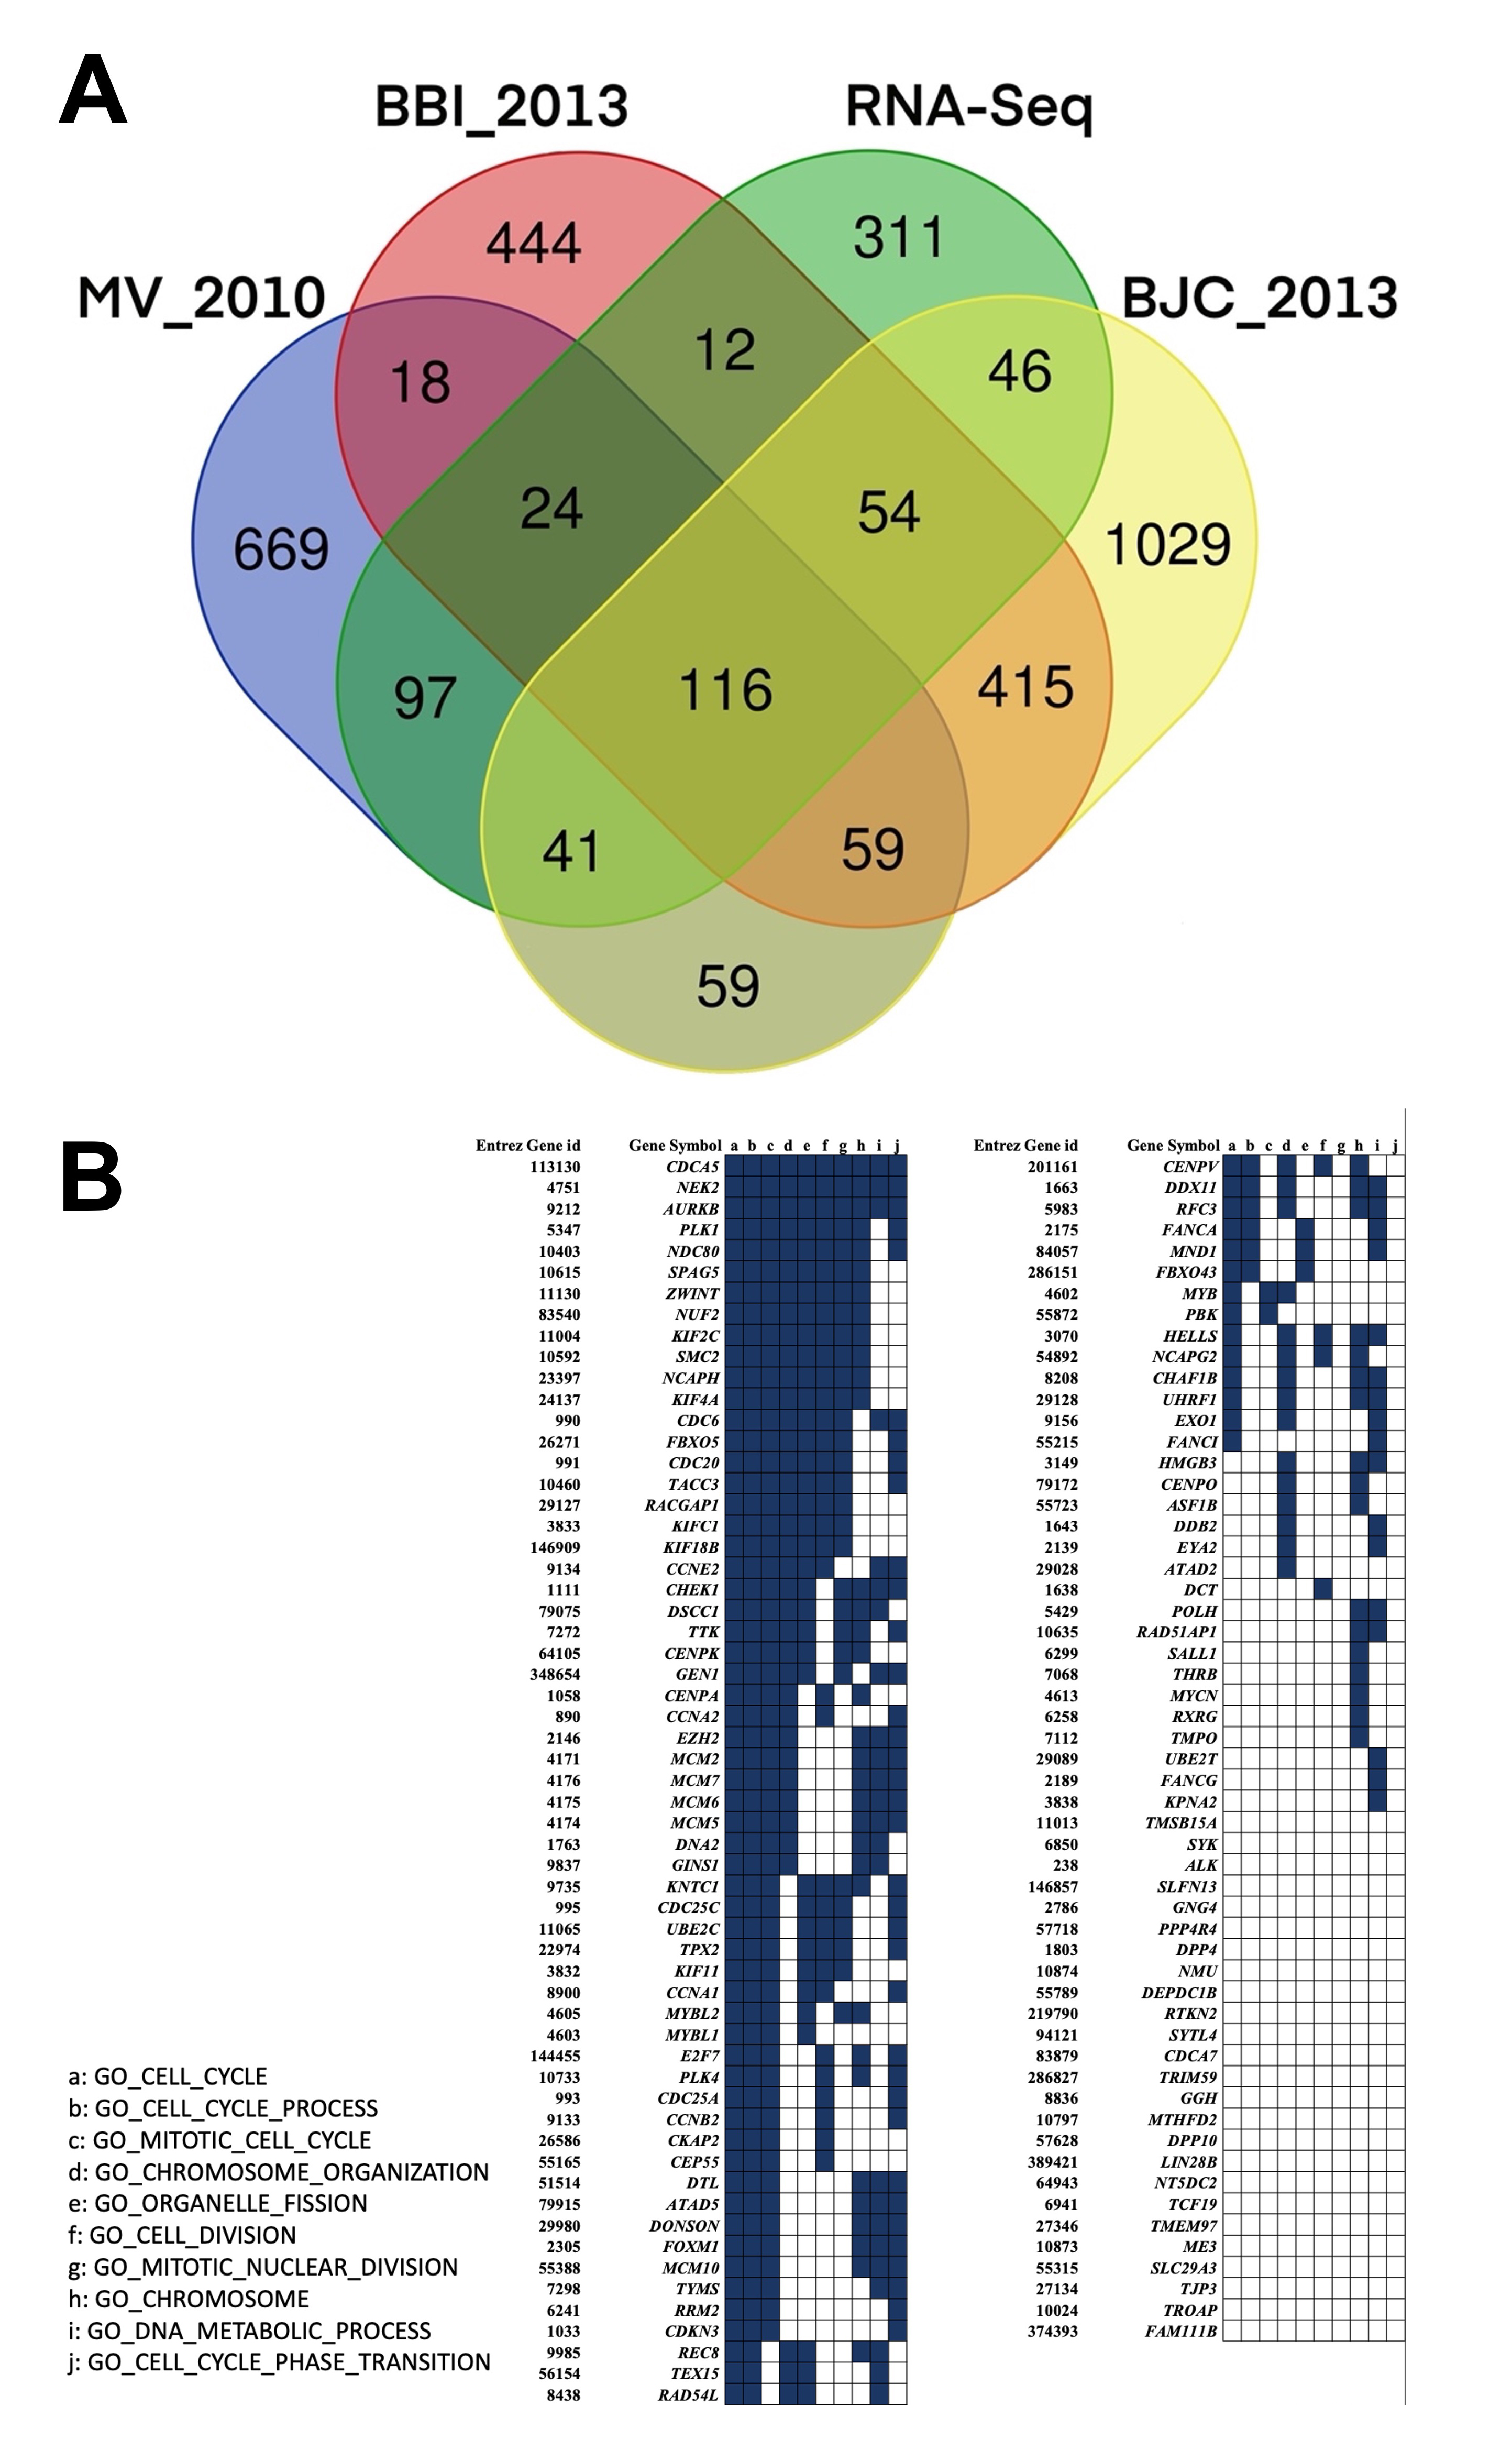
 Figure 1 of
Moolsuwan, Mol Vis 2022; 28:192-201.
Figure 1 of
Moolsuwan, Mol Vis 2022; 28:192-201.