Figure 1. mRNA expression profile of hsa-miR-150-5p-transfected cells. The figure depicts the expression profiles of A: hsa-miR-150-5p, B: its predicted targets, C: the stem cell markers, D: the differentiation marker, and E: the Wnt signaling regulators upon transfection with the hsa-miR-150-5p mimic and inhibitor. The relative mRNA/miRNA expressions
in the mimic- and inhibitor-transfected cells were quantified in comparison with those of the controls by using qPCR with
SYBR Green chemistry. Each sample (n = 3) was run in triplicate. The data were expressed as mean ± SD, and the relative fold
change of expression (RQ) was calculated using the 2-∆∆CT method after normalization with GAPDH (reference gene)/RNU6B (reference microRNA). **p < 0.001; ***p < 0.0001.
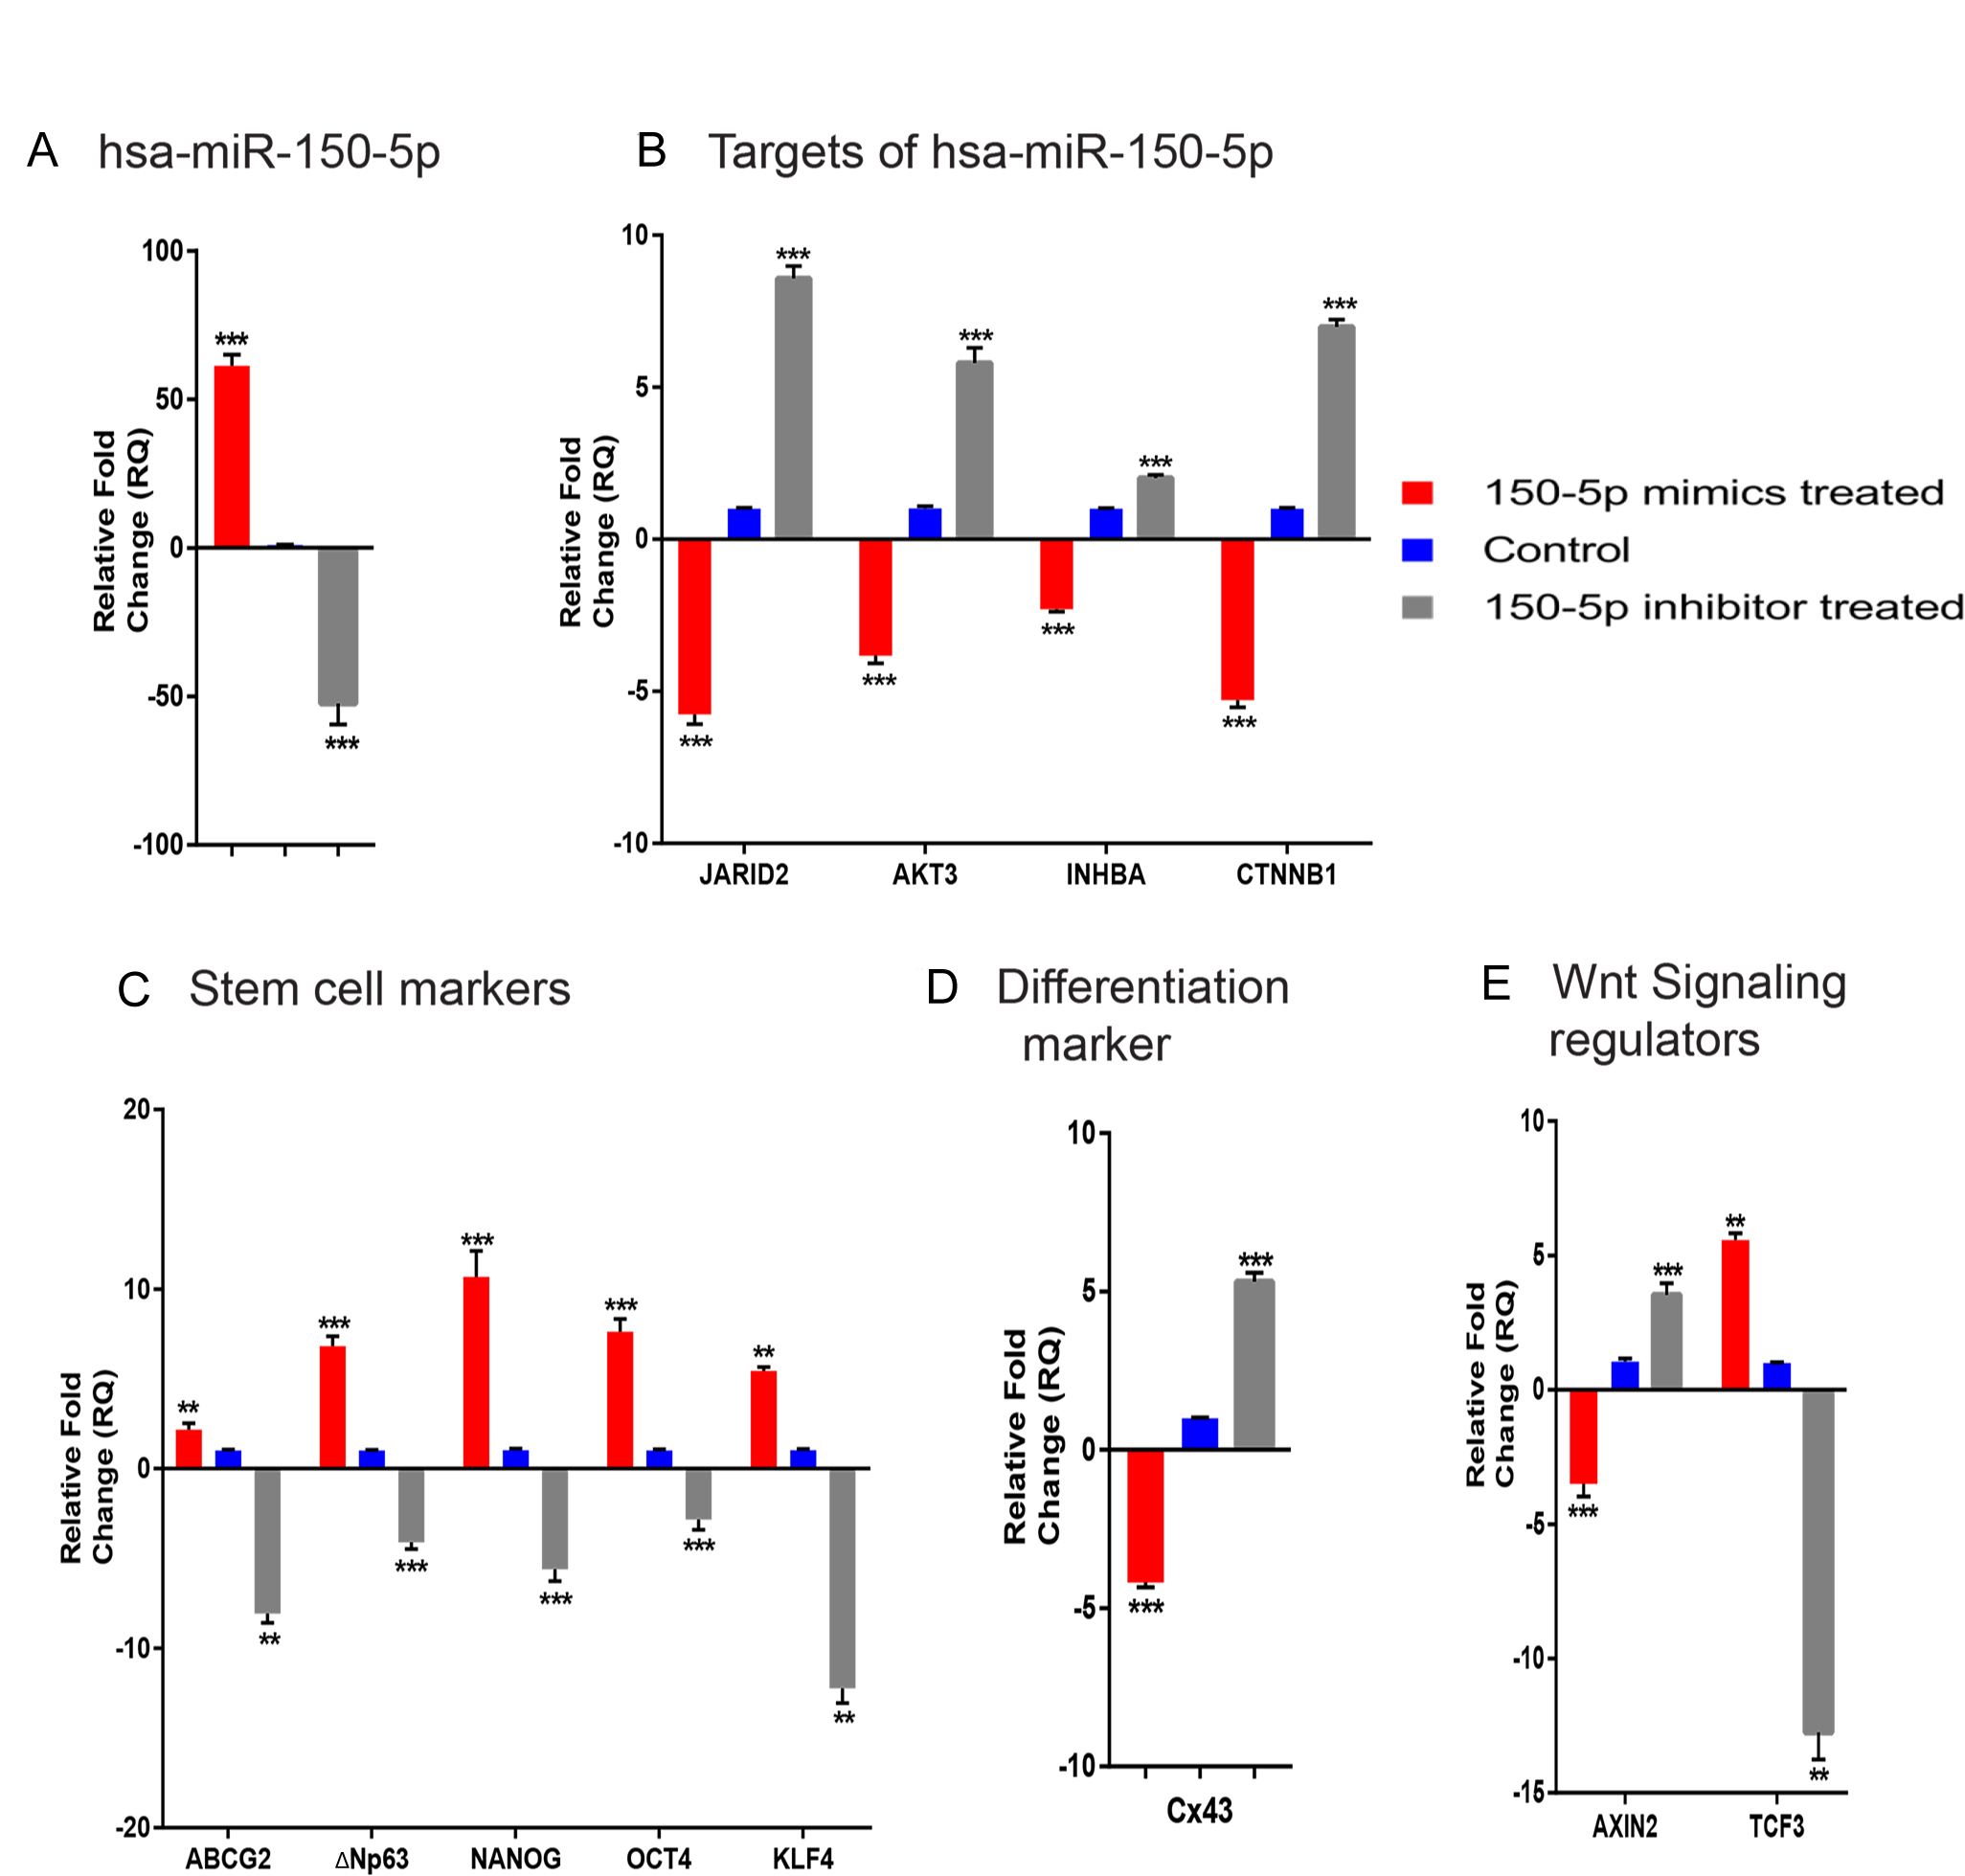
 Figure 1 of
Kalaimani, Mol Vis 2022; 28:178-191.
Figure 1 of
Kalaimani, Mol Vis 2022; 28:178-191.