Figure 1. IOP profiles of Brown Norway rats subjected to 4 weeks of IOP elevation and either untreated or treated with macitentan. Plots
of average intraocular pressure (IOP) measurements in the left eye for naïve, IOP-elevated untreated, and IOP-elevated macitentan-treated
rats. IOP measurements in each group are represented by a separate color (naïve [black], IOP-elevated untreated [red], and
IOP-elevated macitentan-treated [blue]). IOP values were significantly higher at all time points in the IOP-elevated untreated
and the IOP-elevated macitentan-treated rats, compared to naïve rats (except on day 7 in the IOP-elevated macitentan-treated
rats). The decrease in IOP in macitentan-treated rats on day 7, compared to the IOP-elevated untreated rats, was not statistically
significant. Values at each time point represent mean IOP ± SEM; n=7 (3 male rats and 4 female rats) for untreated rats, n=8
(4 male rats and 4 female rats) for macitentan-treated rats, and n=10 (5 male rats and 5 female rats) for naïve rats.
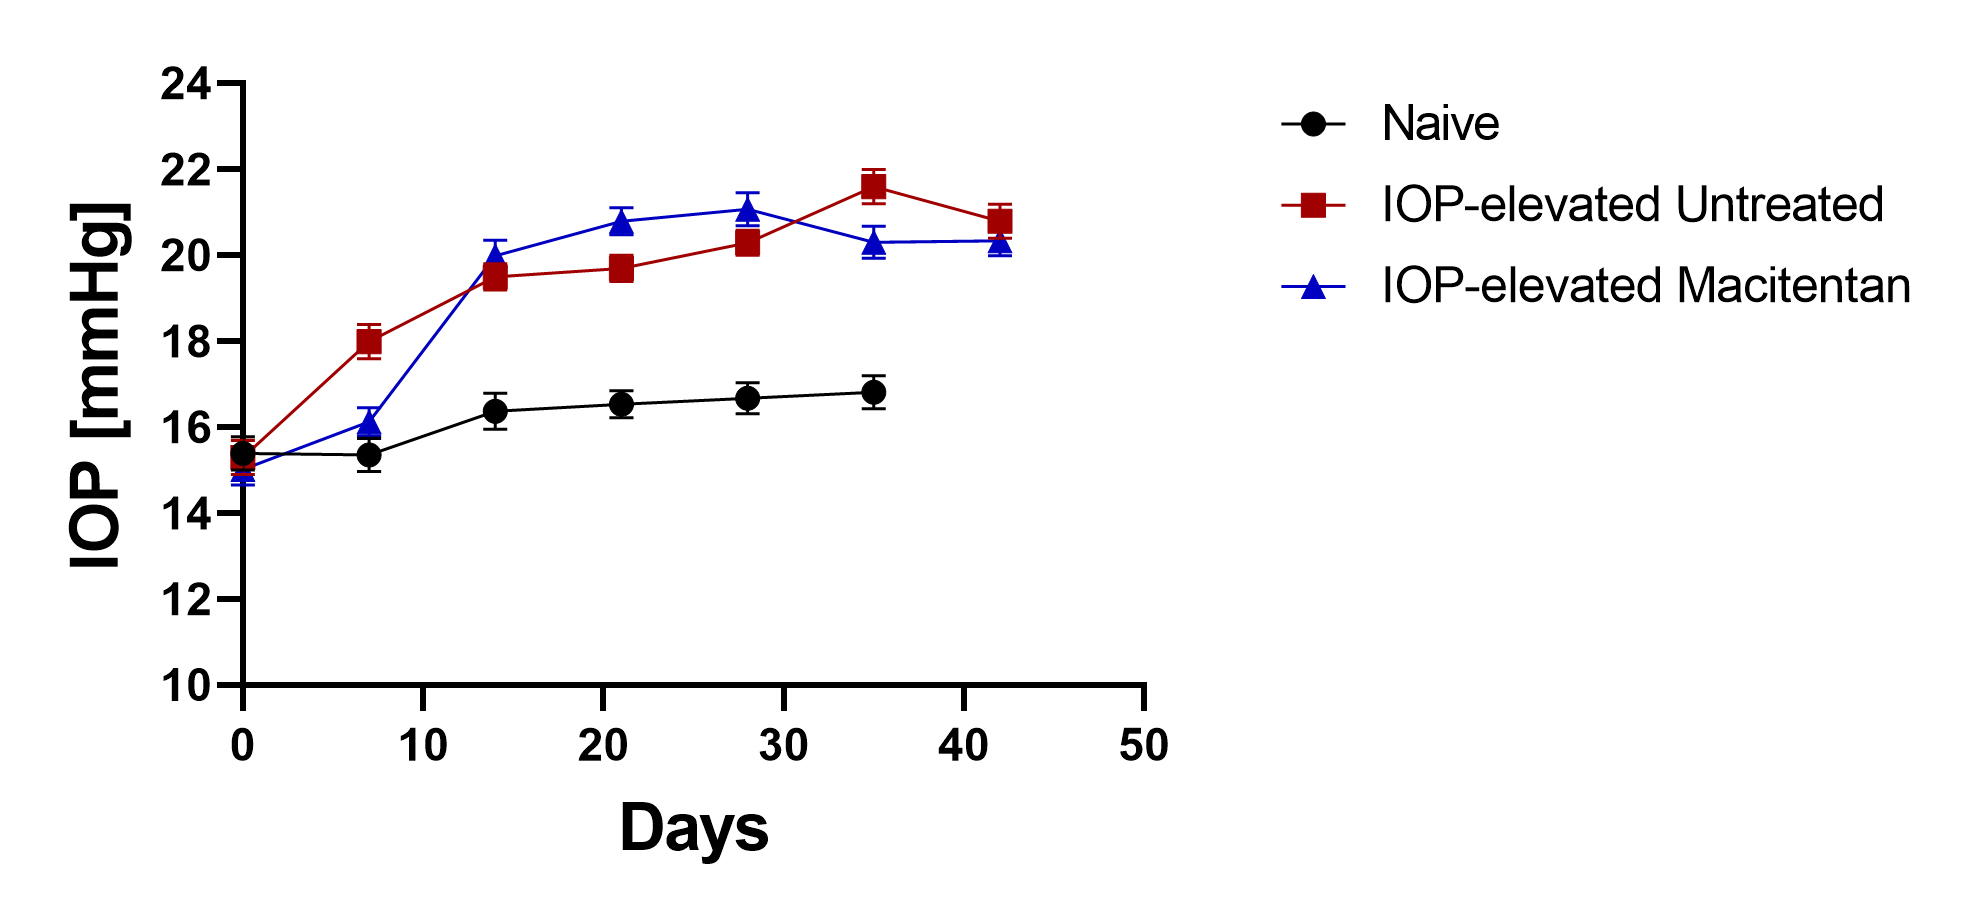
 Figure 1 of
Kodati, Mol Vis 2022; 28:165-177.
Figure 1 of
Kodati, Mol Vis 2022; 28:165-177.