Figure 2 of
Srivastava, Mol Vis 2022; 28:147-164.
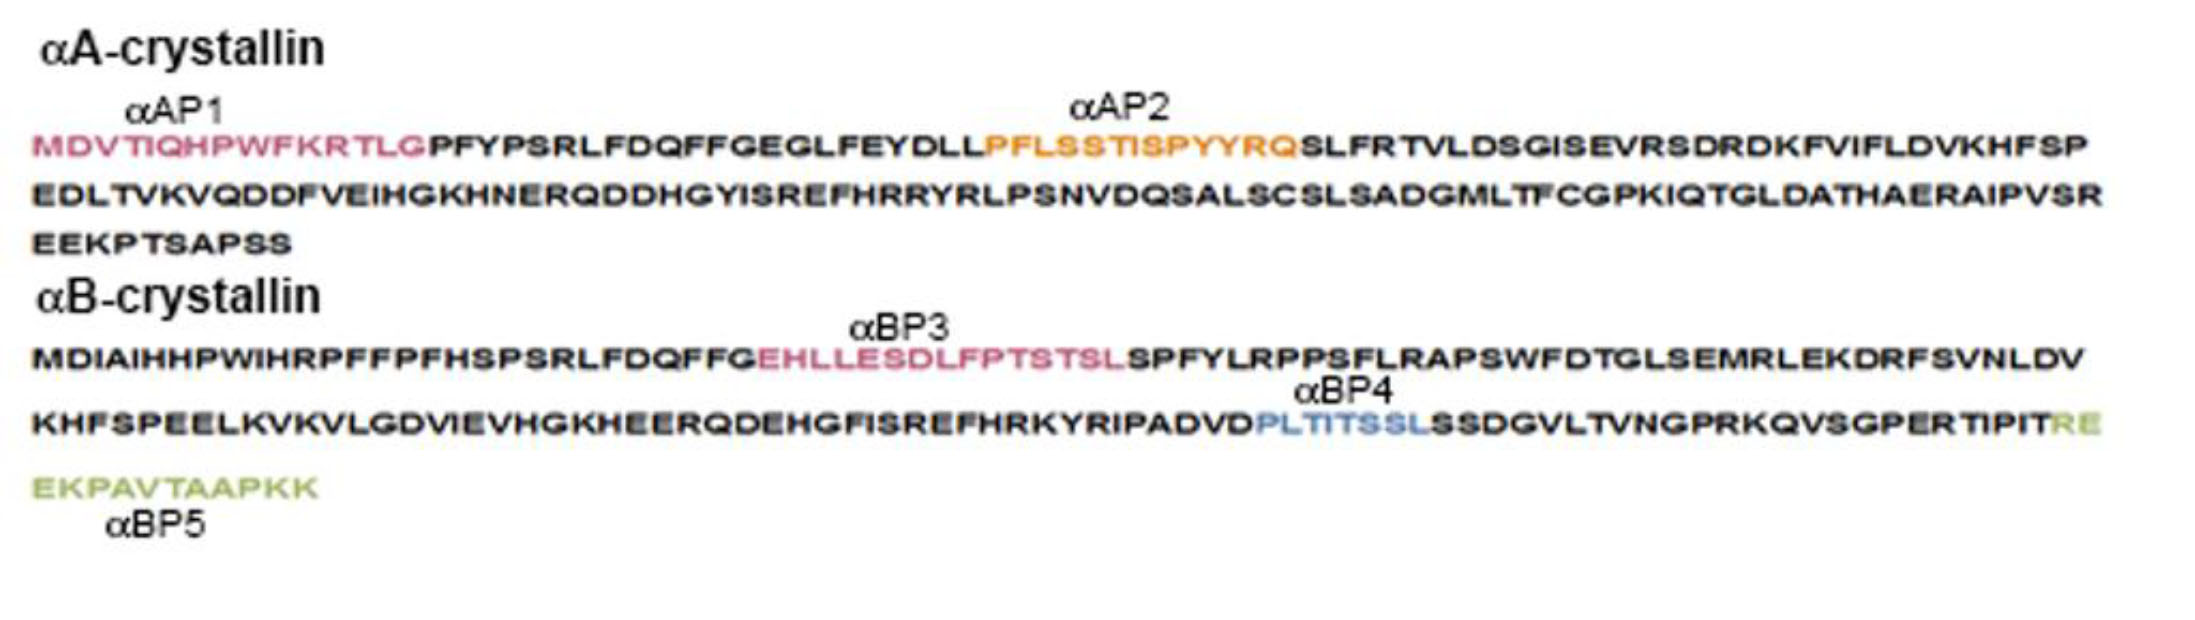
Figure 2.
Diagrammatic representation of the positions of the five selected peptides (αAP1, αAP2, αBP3, αBP4, and αBP5) in αA- and αB-crystallins that were used in the study. These are identified in red, blue, and green.
 Figure 2 of
Srivastava, Mol Vis 2022; 28:147-164.
Figure 2 of
Srivastava, Mol Vis 2022; 28:147-164.