Figure 6 of
Verdina, Mol Vis 2021; 27:78-94.
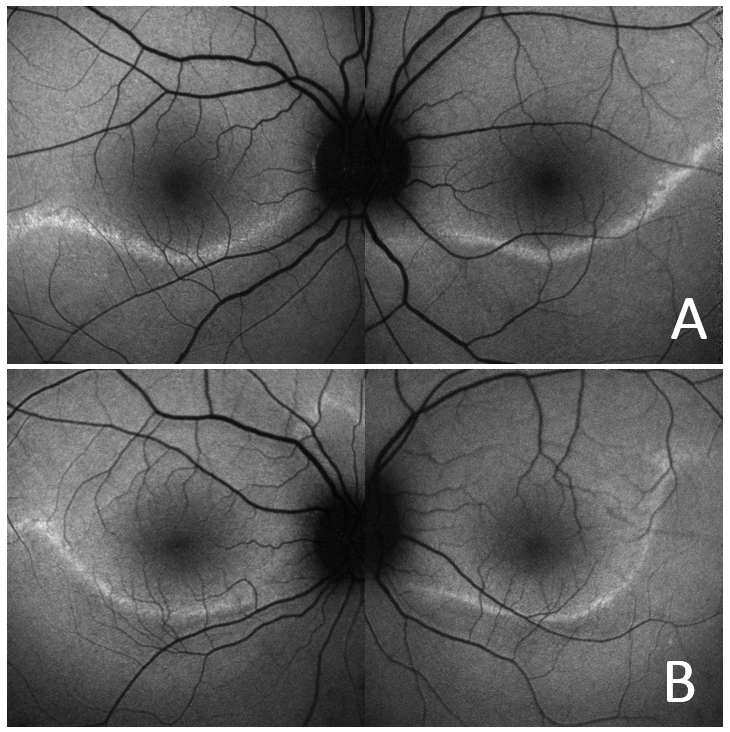
Figure 6.
Fundus autofluorescence imaging. The images show the hyper-AF bands in the inferior sectors in patient 10 (
A
) and patient 11 (
B
). The continuous lines of higher autofluorescence outline the affected retina.
 Figure 6 of
Verdina, Mol Vis 2021; 27:78-94.
Figure 6 of
Verdina, Mol Vis 2021; 27:78-94.