Figure 5 of
Verdina, Mol Vis 2021; 27:78-94.
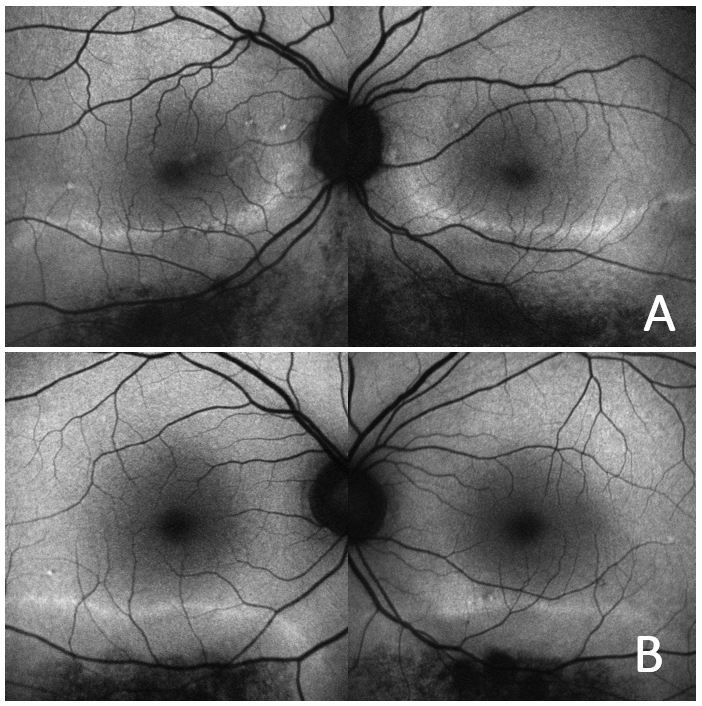
Figure 5.
Fundus autofluorescence imaging. The images show the demarcation line of hyper-AF in the affected quadrant in patient 1 (
A
) and patient 2 (
B
). This line represents the boundary between functional and non-functional areas of the retina.
 Figure 5 of
Verdina, Mol Vis 2021; 27:78-94.
Figure 5 of
Verdina, Mol Vis 2021; 27:78-94.