Figure 4 of
Verdina, Mol Vis 2021; 27:78-94.
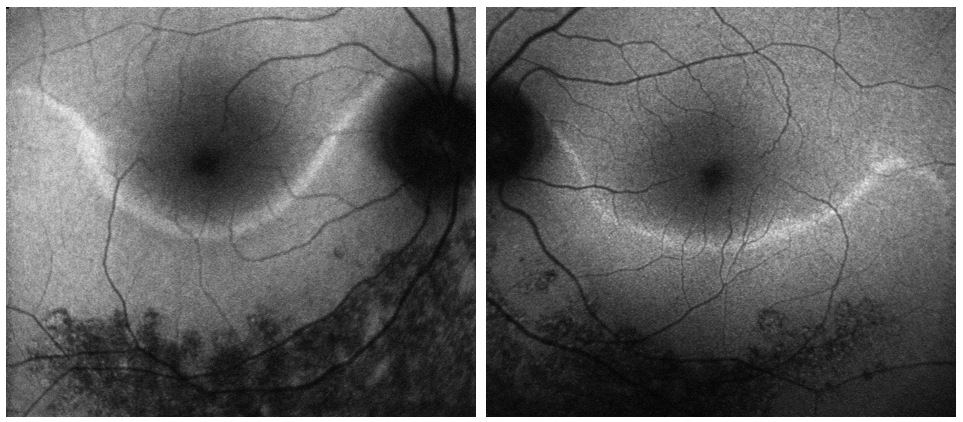
Figure 4.
Fundus autofluorescence imaging. The images are related to patient 3 and show hyper-AF arcs associated with the transition zone between the normal-functioning retina and the diseased retina.
 Figure 4 of
Verdina, Mol Vis 2021; 27:78-94.
Figure 4 of
Verdina, Mol Vis 2021; 27:78-94.