Figure 4. Expression of autophagy-related proteins in glaucoma rat retinas. A: Representative images of immunohistochemical (IHC) staining of ATG5 protein in rat retinas. B: Quantitative analysis of ATG5 IHC scores. The data are the mean ± standard error of mean (SEM; n=5). * indicates a statistical
significance with p value <0.05 compared to the control group. C: Representative western blot graphs of p-mTOR, mTOR, p-AKT, AKT, p-PI3K, PI3K, LC3-I, LC3-II, and GAPDH. The original blots
were attached in the additional file. D: Quantitative densitometry of western blots. The data are the mean ± standard error of mean (SEM; n=5). * indicates a statistical
significance with p value <0.05 compared to the control group; ** indicates a statistical significance with p value <0.01
compared to the control group; **** indicates a statistical significance with p value <0.001 compared to the control group.
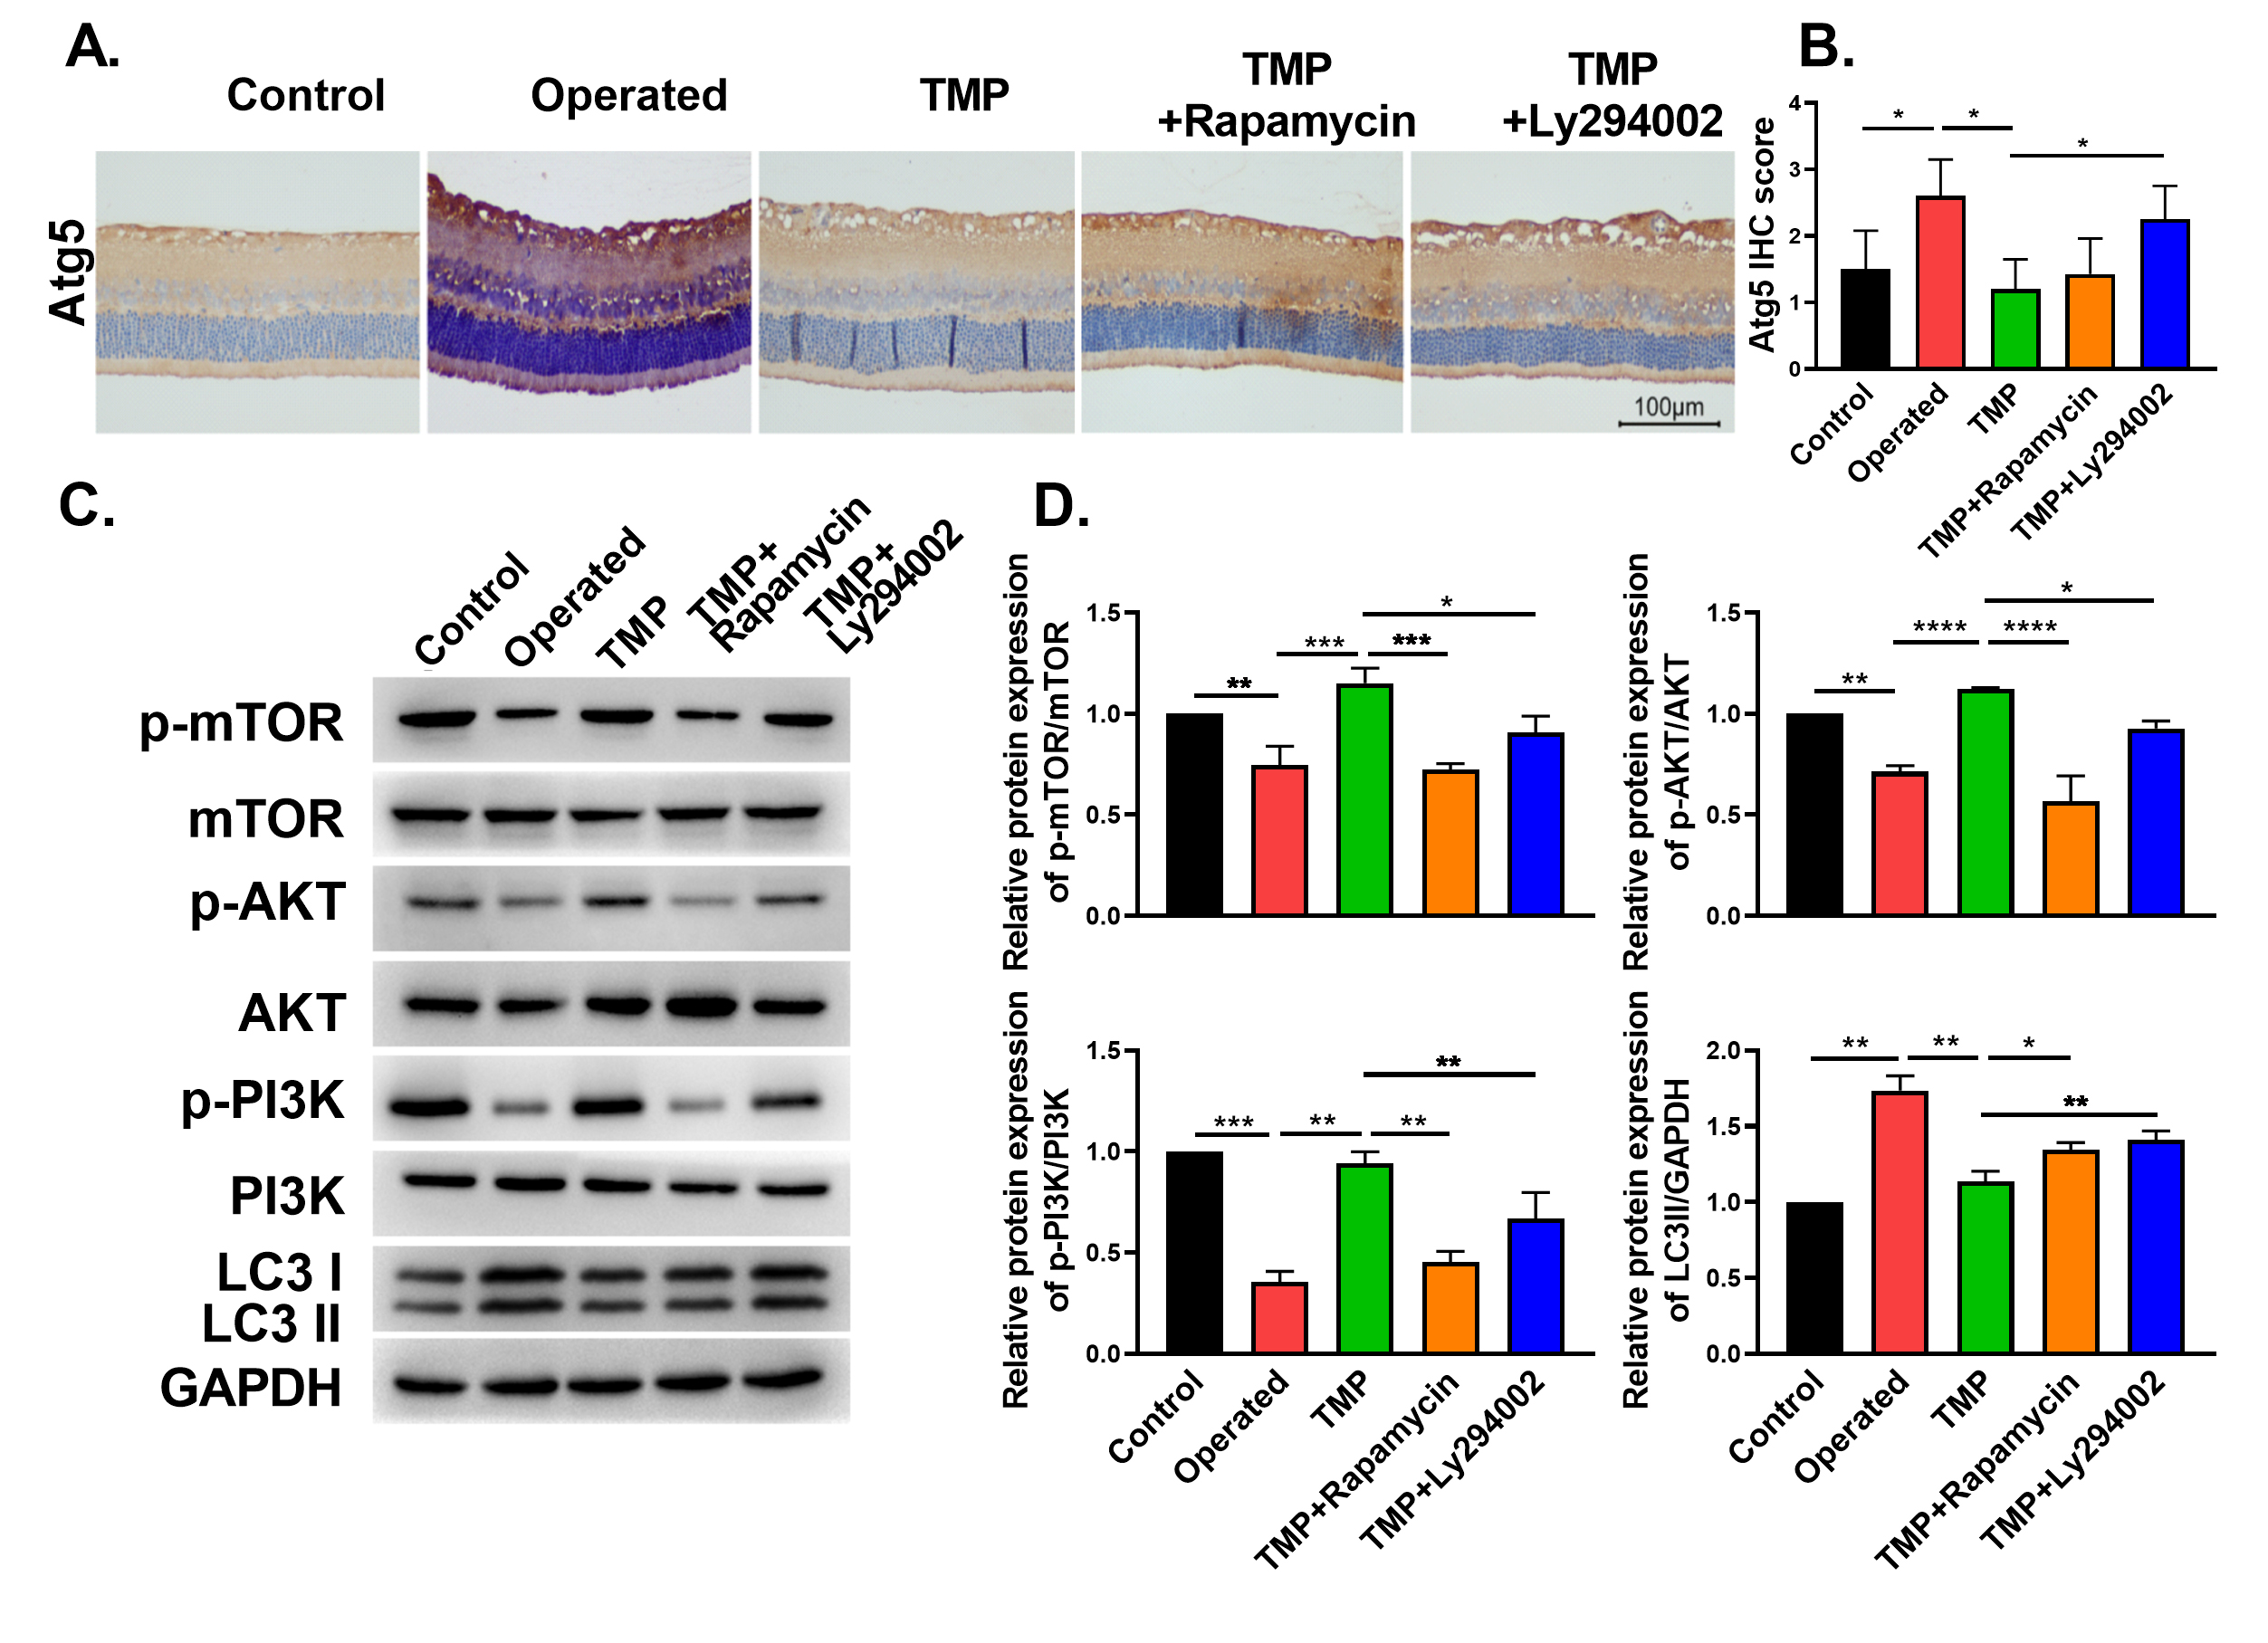
 Figure 4 of
Du, Mol Vis 2021; 27:725-733.
Figure 4 of
Du, Mol Vis 2021; 27:725-733.