Figure 2. H&E and TUNEL staining of retina sections. A: Representative light microscopic images of H&E staining retina sections. Scale bar: 100 μm. ONL, outer nuclear layer; OPL,
outer plexiform layer; INL, inner nuclear layer; IPL, inner plexiform layer; GCL, ganglion cell layer. B: Images of TUNEL staining of retinal sections. C: Quantitative analysis of percentages of TUNEL-positive cells in retinal sections. The data are the mean ± standard error
of mean (SEM; n=5). ** indicates a statistical significance with p value <0.01 compared to the control group.
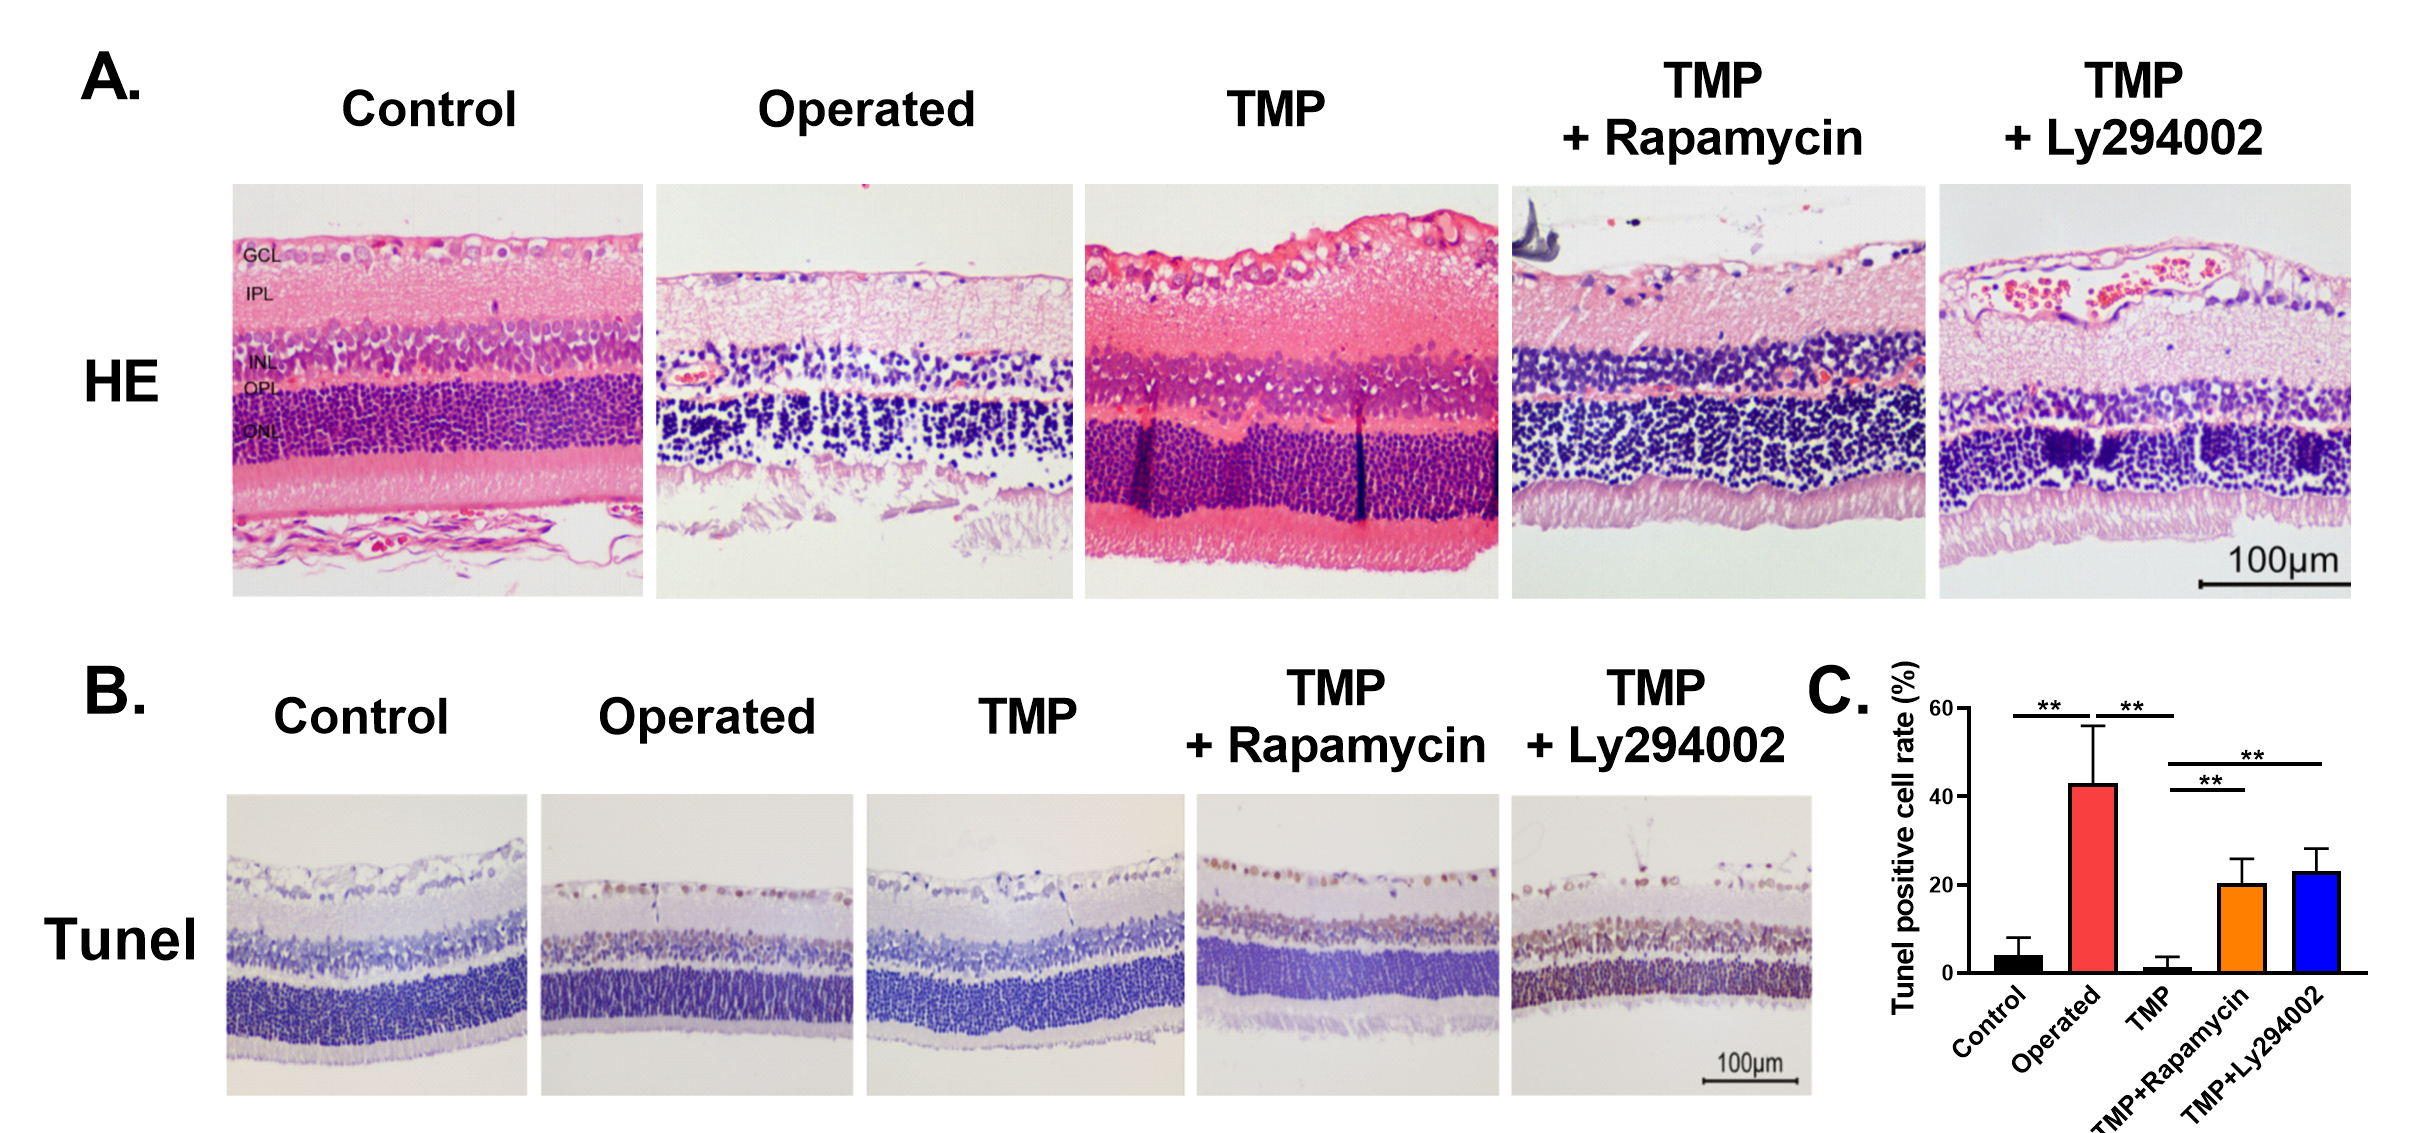
 Figure 2 of
Du, Mol Vis 2021; 27:725-733.
Figure 2 of
Du, Mol Vis 2021; 27:725-733.