Figure 2. Electropherogram and PCR-RE for m.3460G>A; m.11778G>A. A and B: Electropherogram of wild-type and mutant m.3460G>A. C and D: Wild-type and mutant m.11778G>A. E: 4% agarose gel electrophoresis of PCR-RE showing the plasmy status of the m.3460G>A and m.11778G>A mutations, respectively;
M: size marker; Uncut: non-restricted PC product.
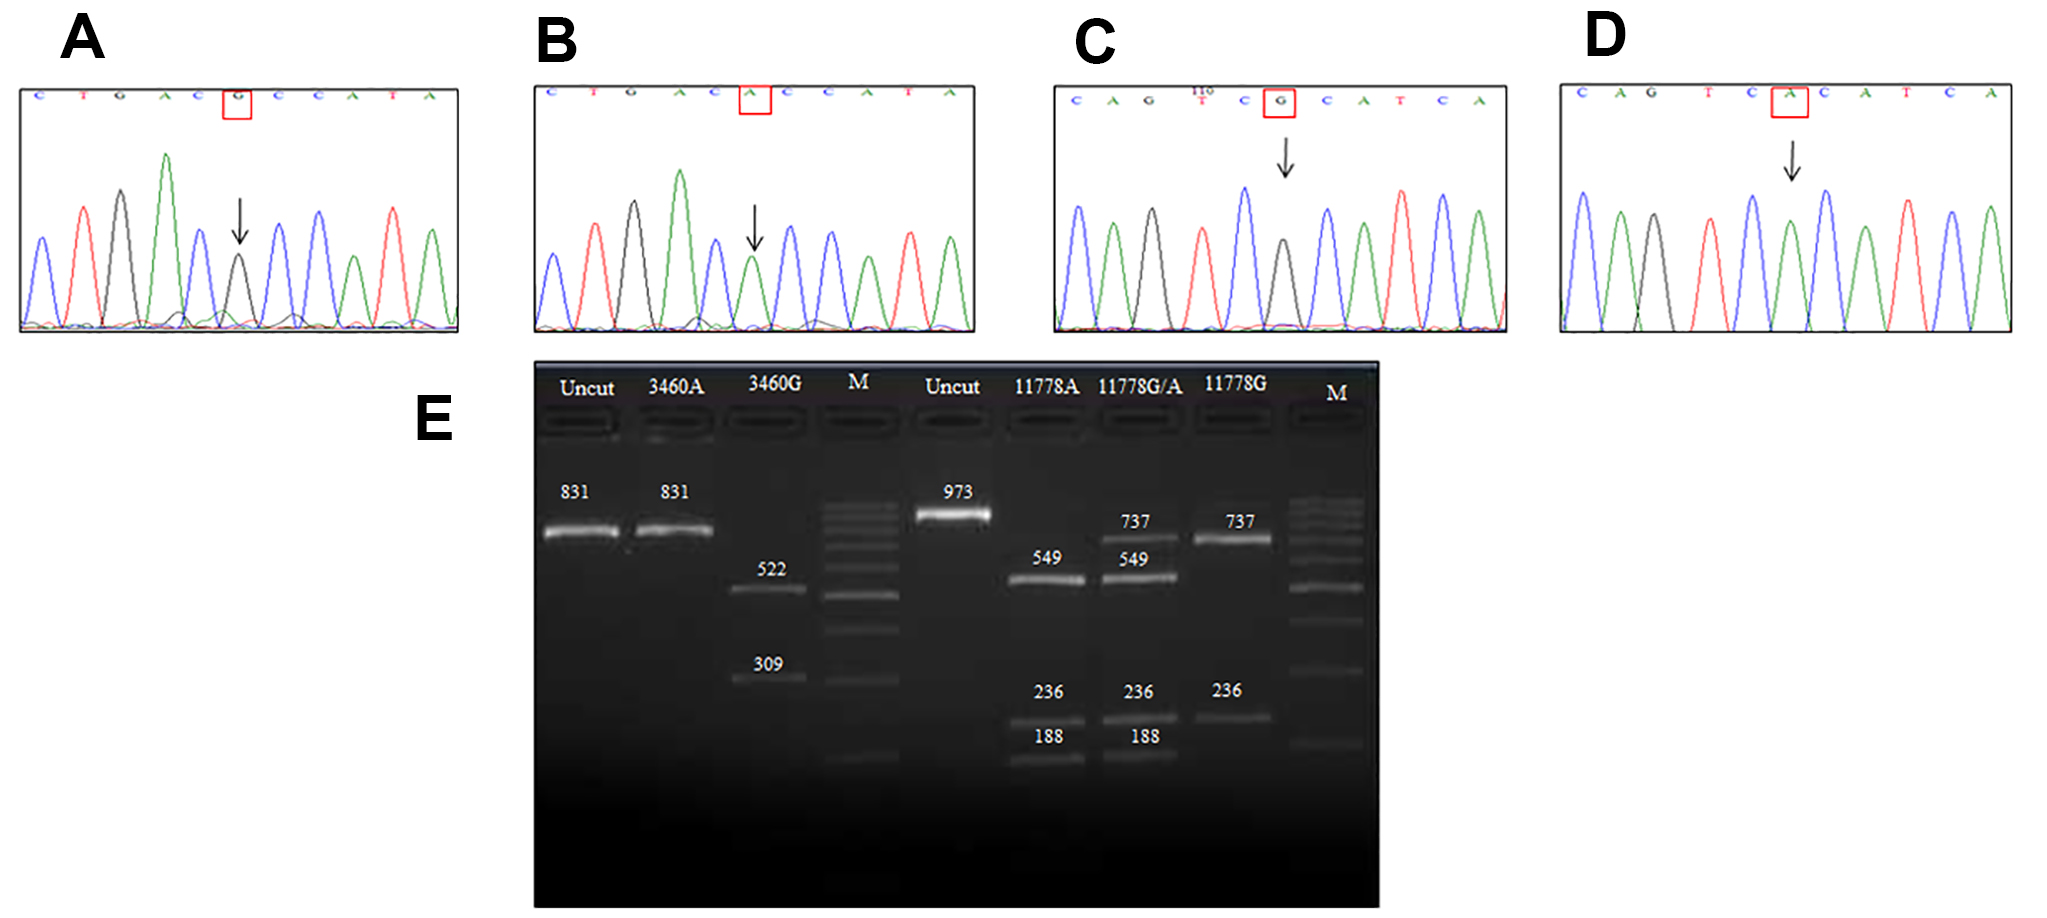
 Figure 2 of
Sundaramurthy, Mol Vis 2021; 27:718-724.
Figure 2 of
Sundaramurthy, Mol Vis 2021; 27:718-724.