Figure 3 of
Zheng, Mol Vis 2021; 27:706-717.
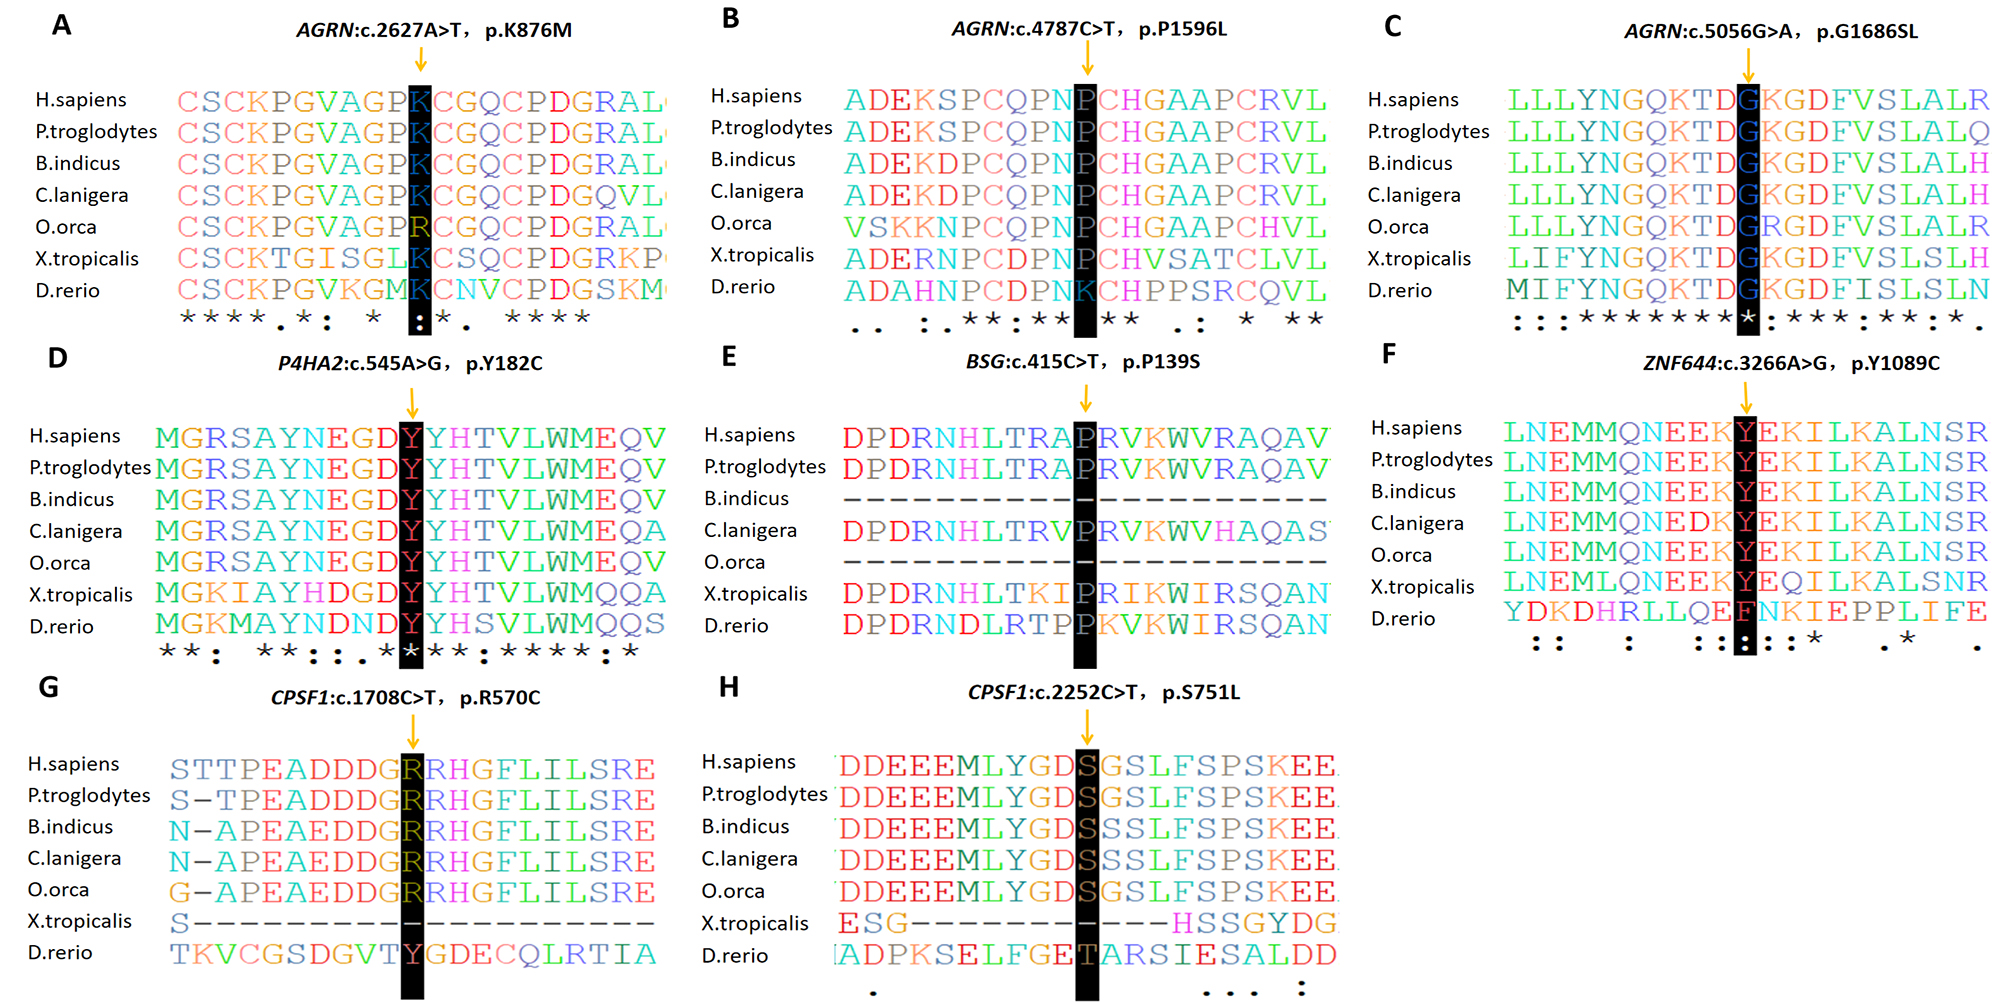
Figure 3.
Evolutionarily conserved analysis manifests evolutionary conservation of the variants. The arrow presents the location of the variants (
A
–
H)
. Sequencing alignments visualized with Clustal Omega.
 Figure 3 of
Zheng, Mol Vis 2021; 27:706-717.
Figure 3 of
Zheng, Mol Vis 2021; 27:706-717.