Figure 6. Quercetin relieved endoplasmic reticulum (ER) stress and abnormal lipid metabolism in AQP5−/− mice. A: Transmission electron microscopy (TEM) shows the ultrastructure of the acinar cells. B: Western blot bands for CHOP, GRP78, Caspase12, Bax, Bcl-2, and GAPDH. C: Quantified intensities of western blot bands for CHOP, GRP78, Caspase12, Bax, and Bcl-2 compared with GAPDH (n = 3 samples).
D: Oil Red O (ORO) staining. E: ORO staining intensity was analyzed by ImageJ software (n = 6 samples). F: Real-time PCR analysis showed PPARα, CPT1α, and CPT2 expression (n = 3 samples). *p<0.05, **p<0.01, **” in line 10 on page 22 to “*p<0.05, **p<0.001, ***p<0.0001.
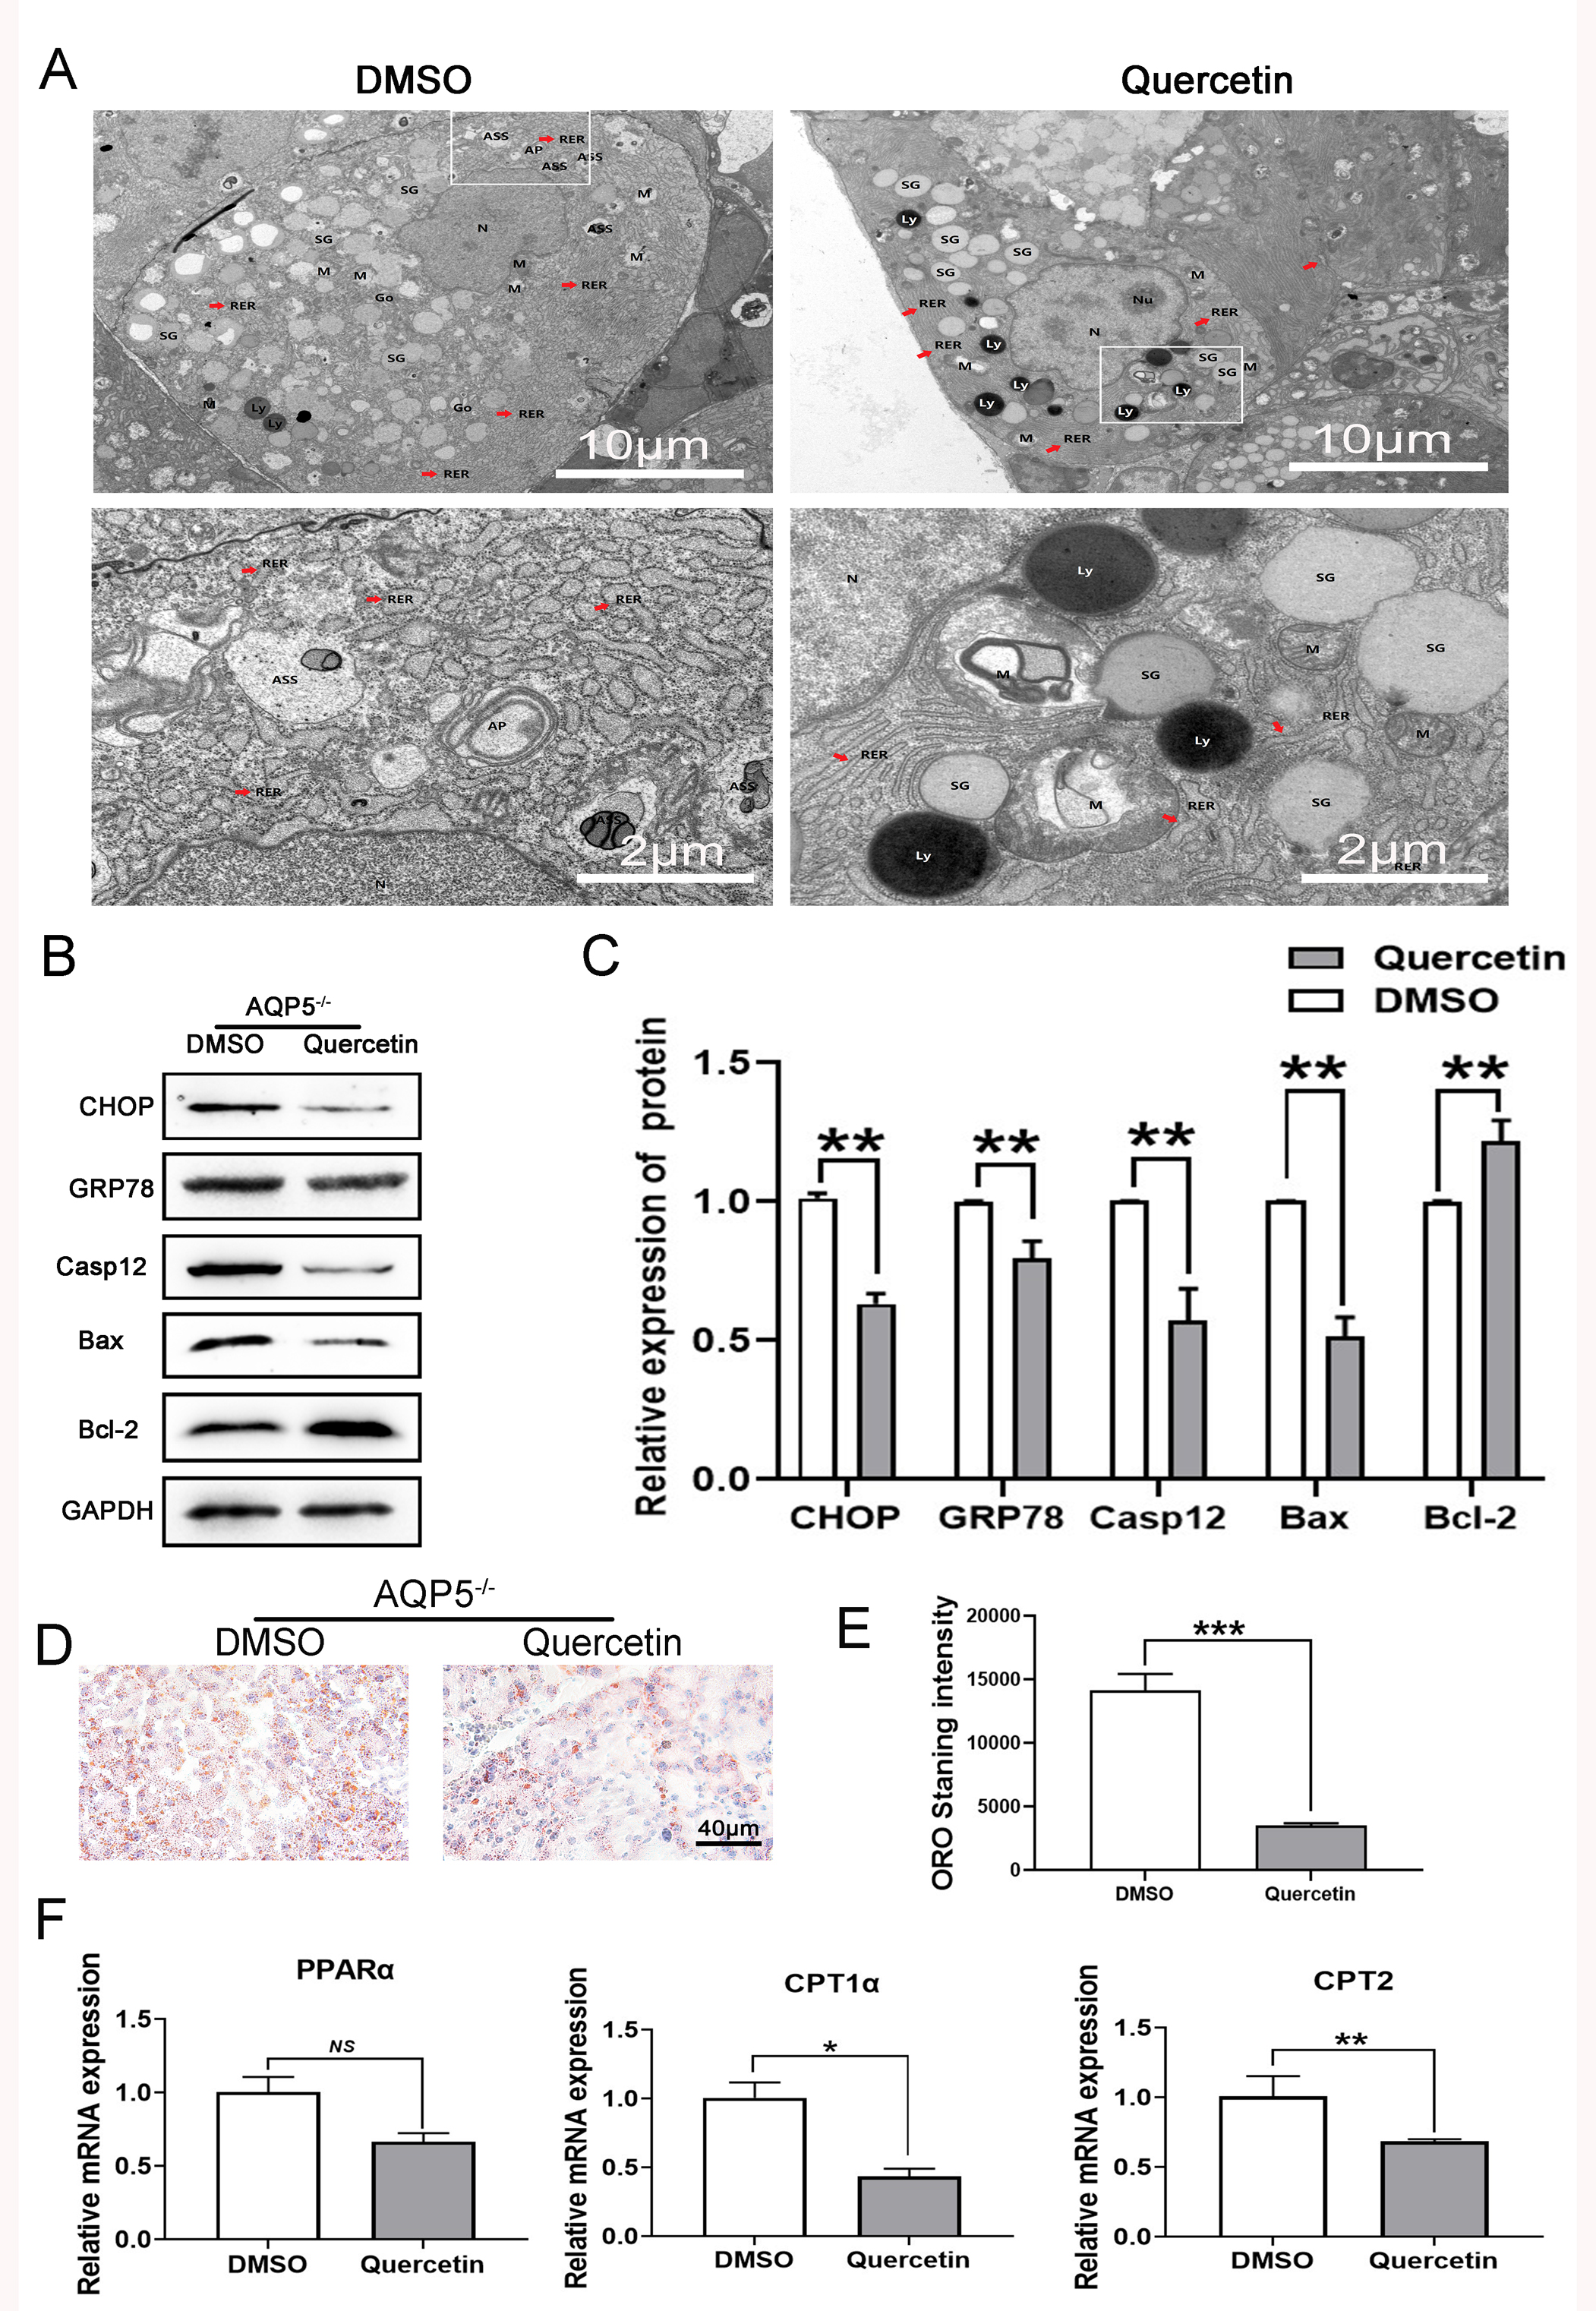
 Figure 6 of
Hu, Mol Vis 2021; 27:679-690.
Figure 6 of
Hu, Mol Vis 2021; 27:679-690.