Figure 2. AQP5 deficiency induced ultrastructural abnormalities and endoplasmic reticulum (ER) stress in the lacrimal gland. A: Transmission electron microscopy (TEM) showing the ultrastructure of the acinar cells of the lacrimal gland. Data are expressed
as mean ± standard deviation (SD). *p<0.05, **p<0.001. Scale bars: (A) 5 μm, 2 μm. B: The deficiency of AQP5 protein induced endoplasmic reticulum stress in lacrimal glands of mice. Western blot bands for CHOP,
GRP78, Caspase12, Bax, Bcl-2, and GAPDH (n = 3 samples). C: Quantified intensities of western blot bands for CHOP, GRP78, Caspase12, Bax, and Bcl-2 compared with GAPDH (n = 3 samples).
*p<0.05, **p<0.01, *** p<0.0001.
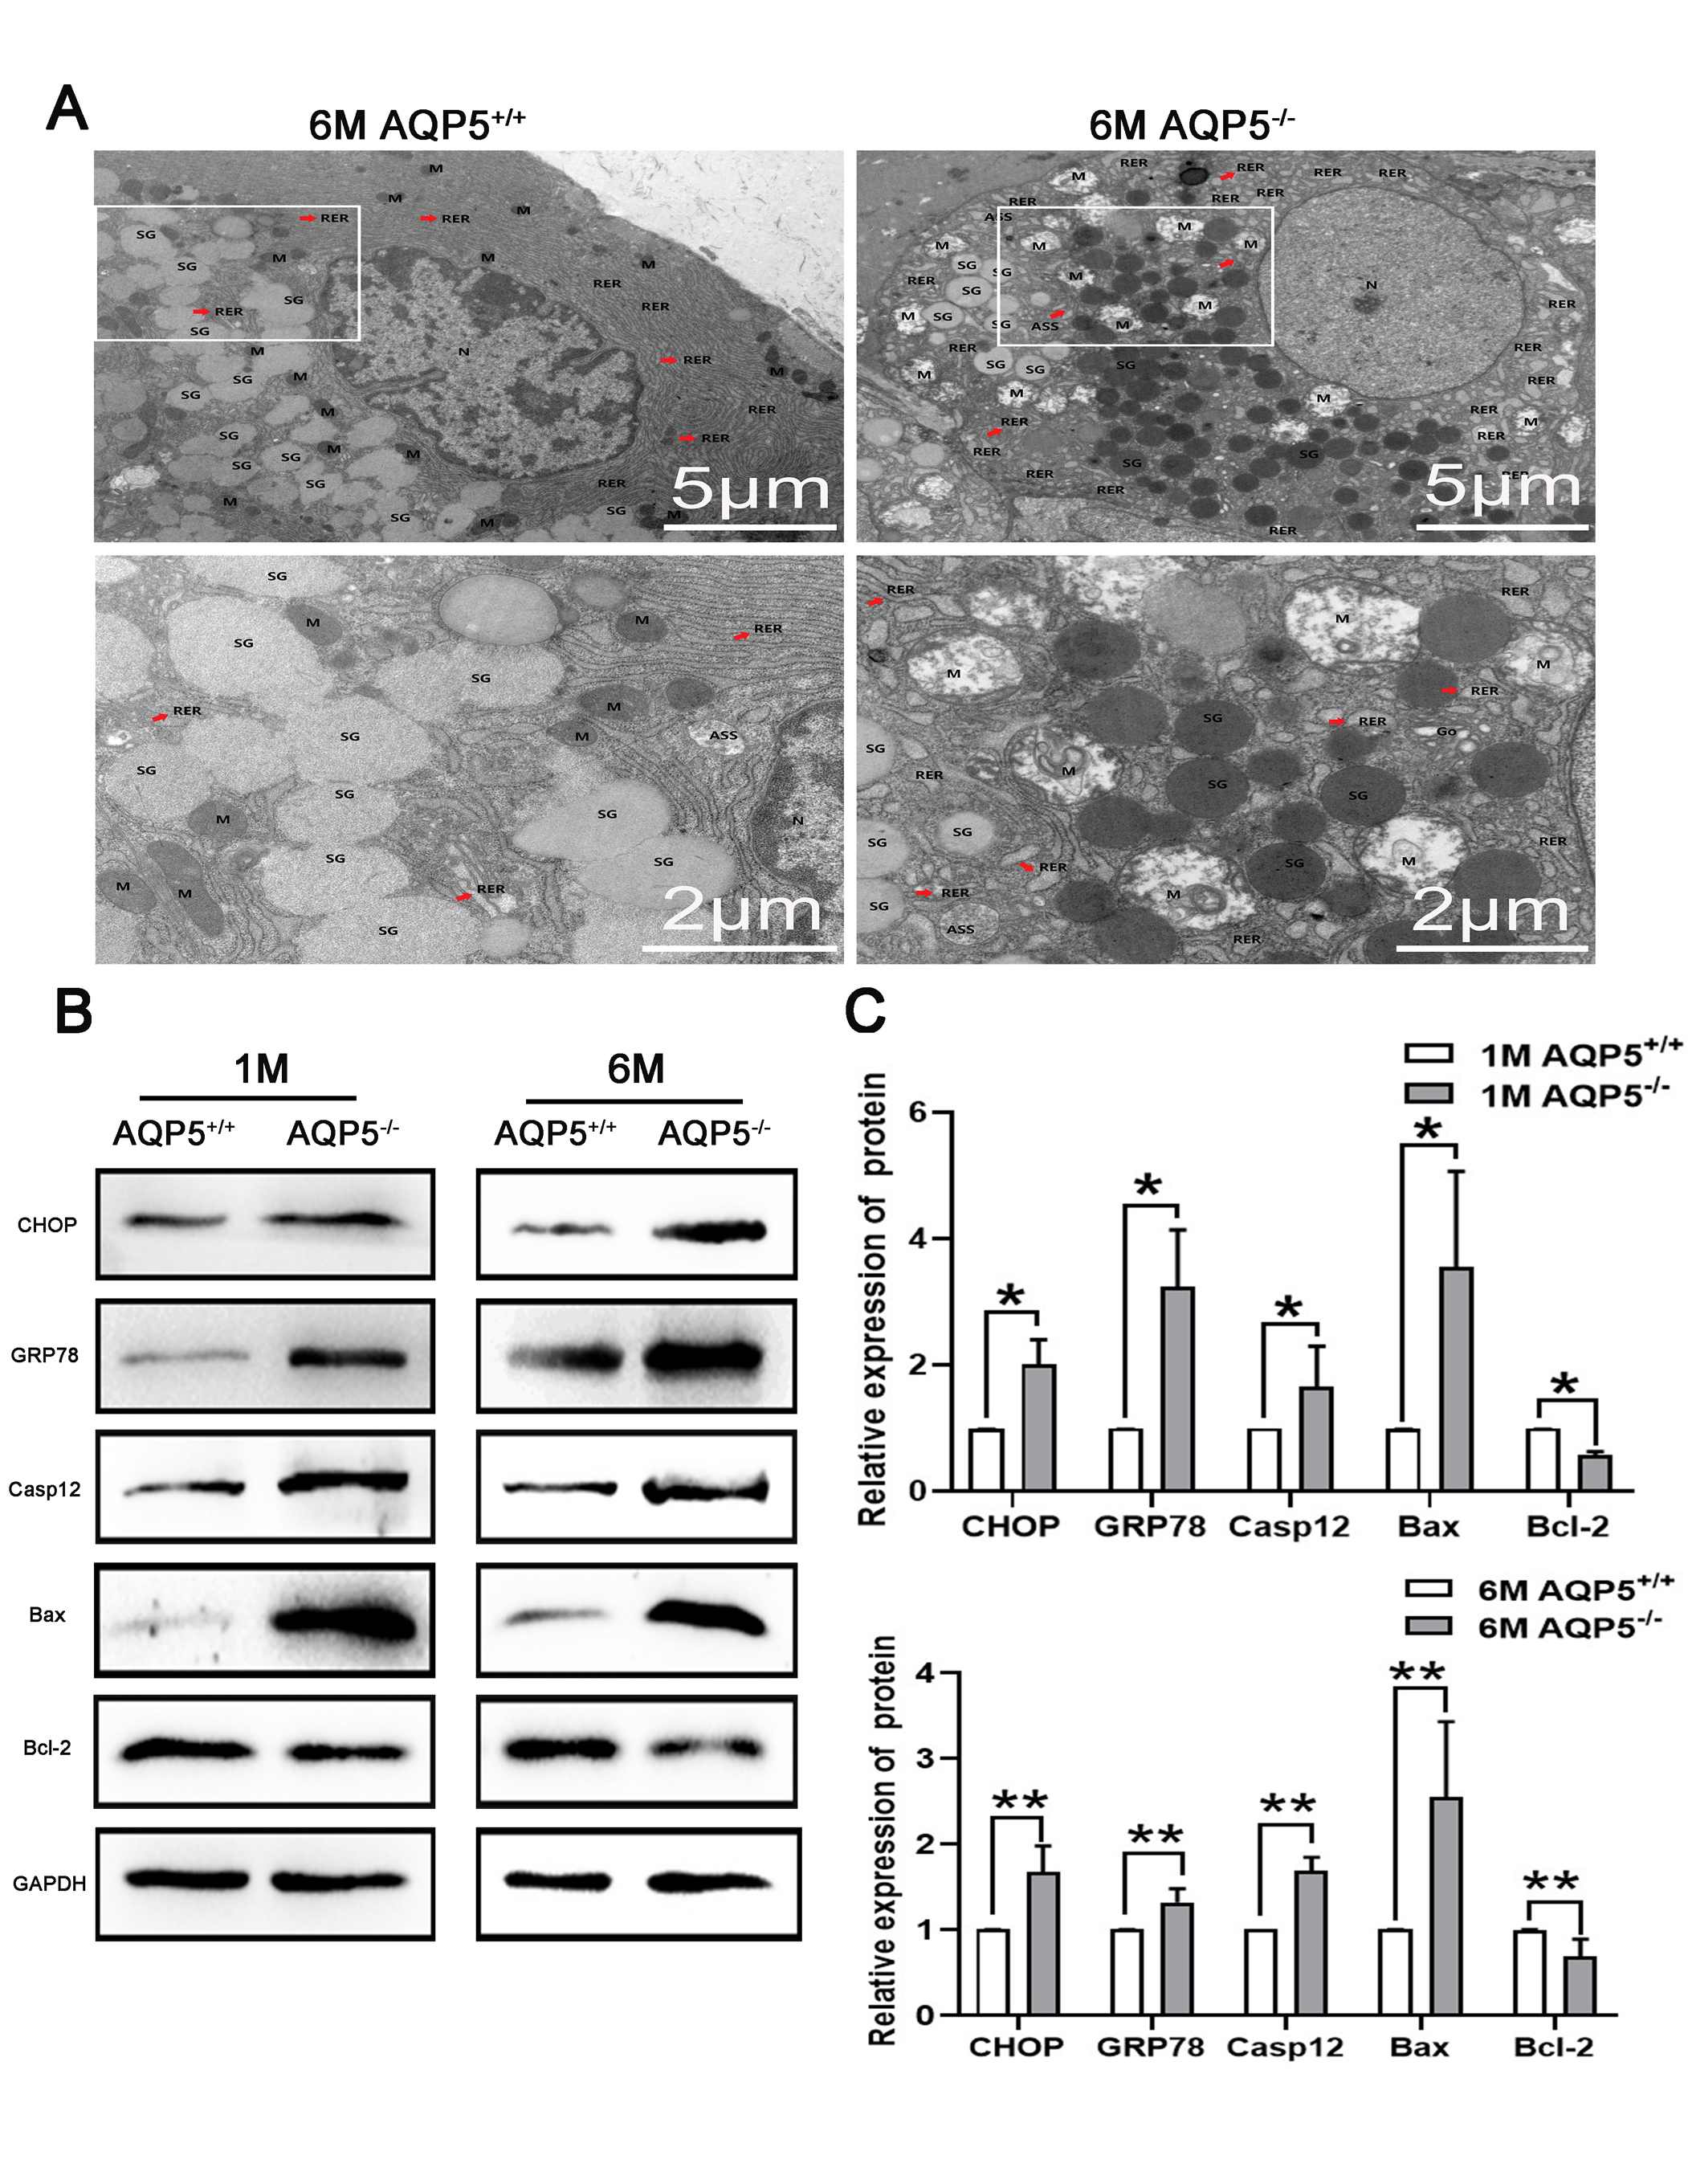
 Figure 2 of
Hu, Mol Vis 2021; 27:679-690.
Figure 2 of
Hu, Mol Vis 2021; 27:679-690.