Figure 7. Quantitation of Transmission Electron Microscopy of collagen fibrils in the Western diet (WD) fed and Standard diet (SD) fed
Ossabaw mini pigs. A and C are fibril graphs that show each connection between collagen fibrils. B and D show the minimum distance between collagen fibrils (red) and the maximum distance between fibrils (blue). E is a graphical representation of maximum interfibrillar distance and F is a graphical representation of minimum interfibrillar distance.
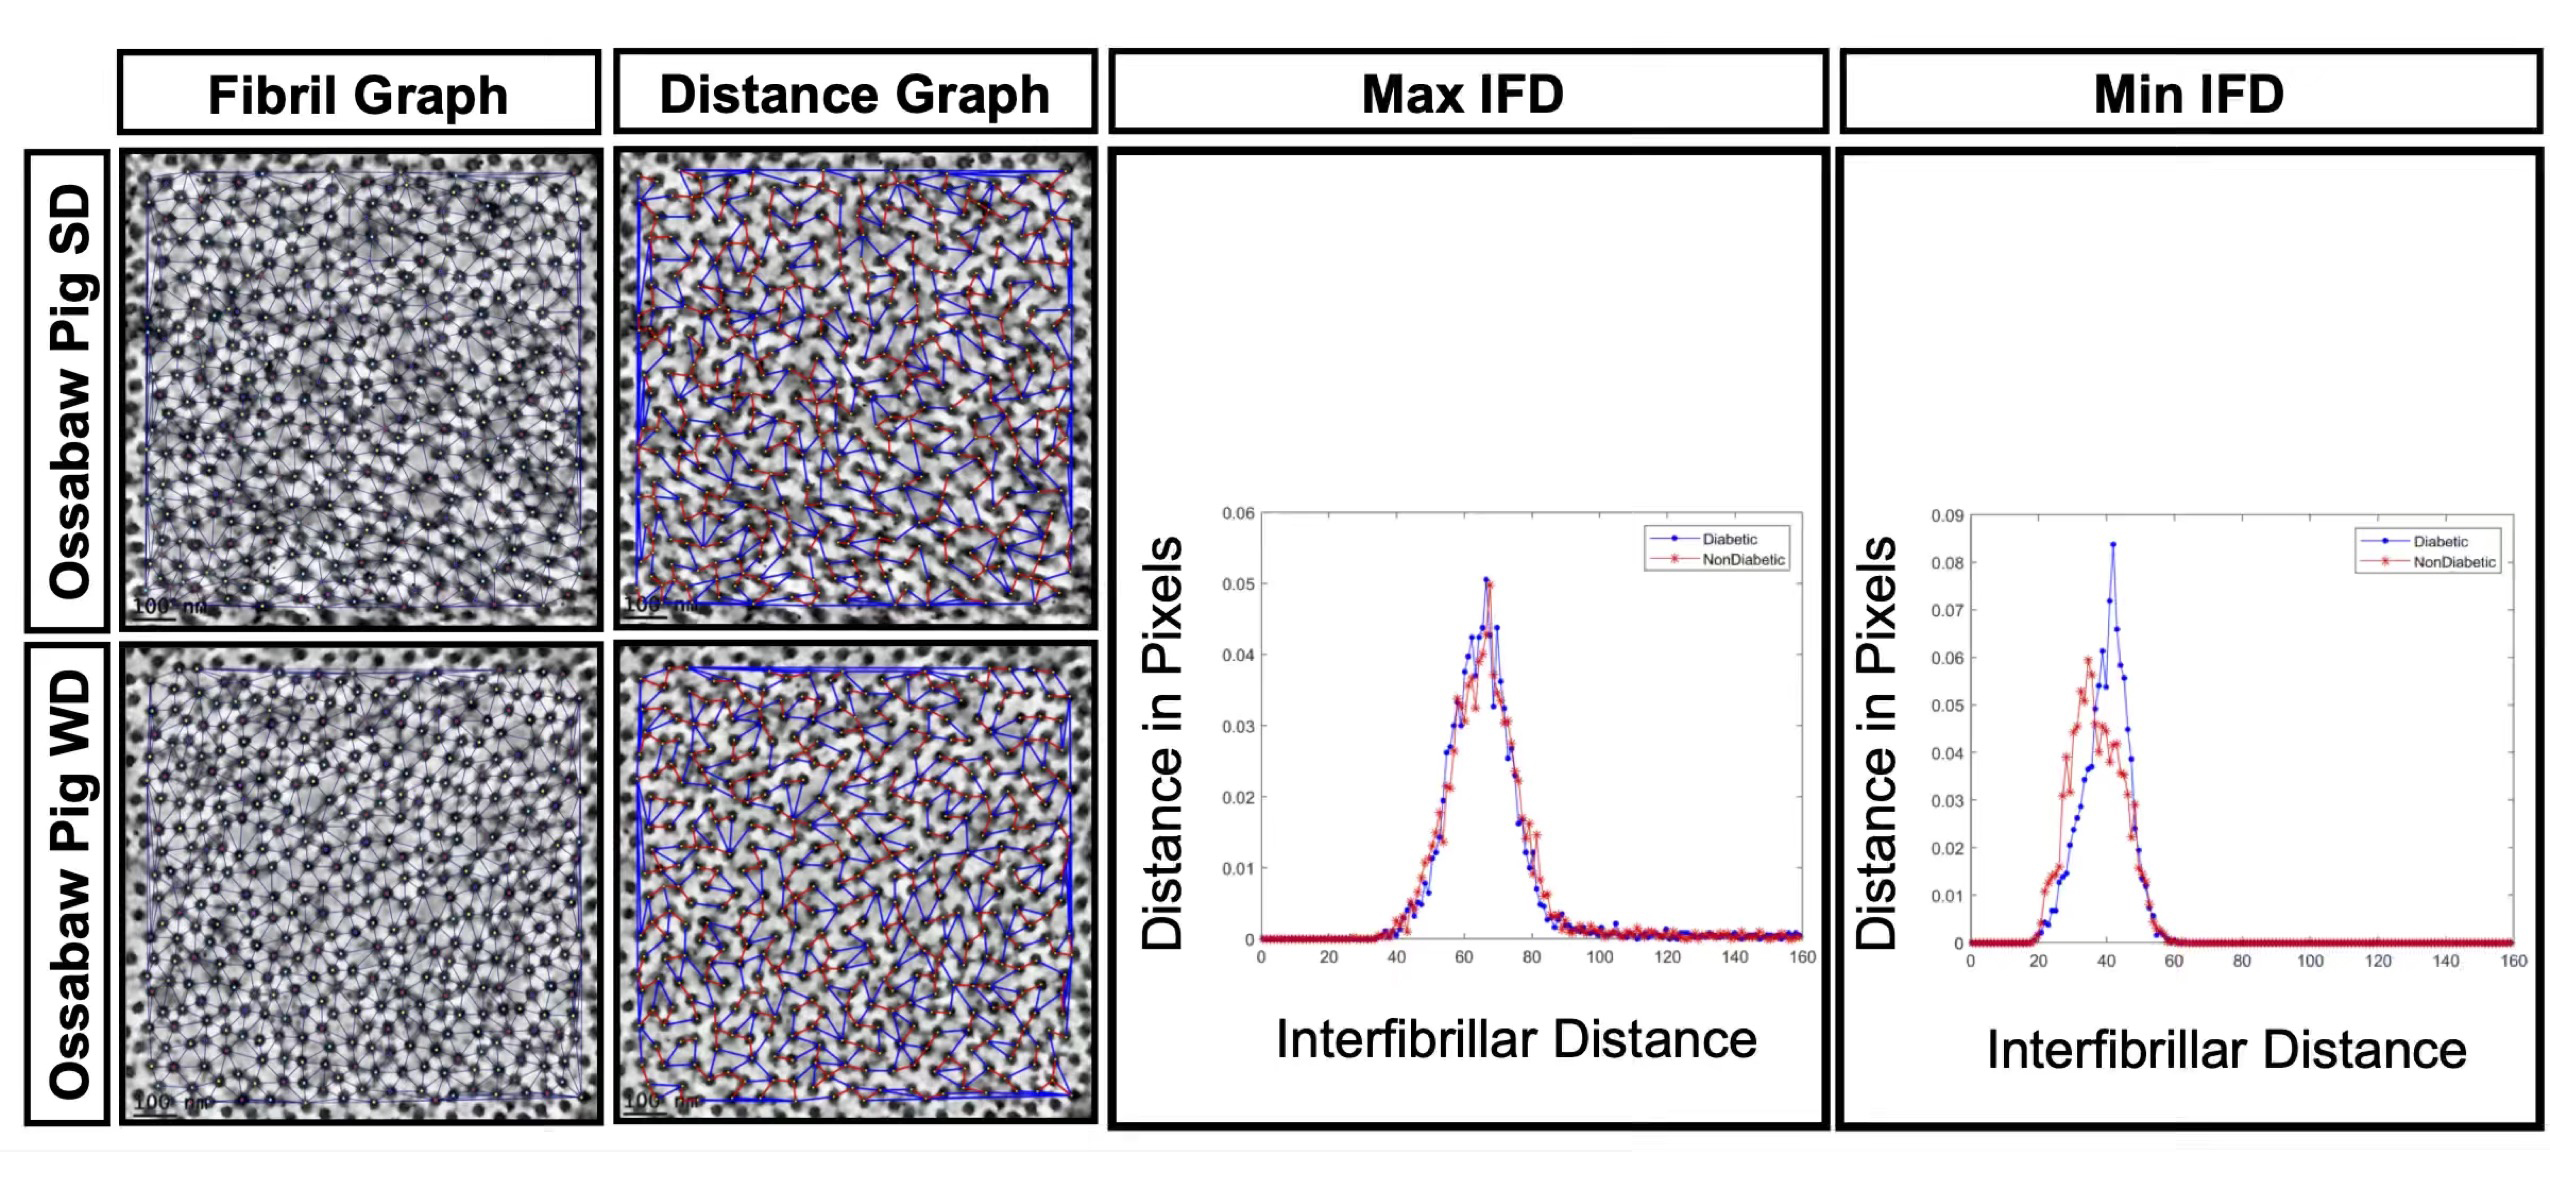
 Figure 7 of
Sinha, Mol Vis 2021; 27:666-678.
Figure 7 of
Sinha, Mol Vis 2021; 27:666-678.