Figure 6. Quantitation of transmission electron microscopy of collagen fibrils in the western diet (WD) fed and Standard diet (SD) fed
Ossabaw mini pigs. Panels A and D are the original transverse section of the transmission electron microscopy images taken at 50,000 magnification. Panels
B and F are segmentations that identify all the collagens present in the figure. Panels C and G are individual red ellipses made around collagen fibrils used to quantify the size of fibrils. Panel H is a graphical representation of collagen fibril sizes found in the image. Western diet pigs show an overall collagen size
difference compared to standard diet pigs.
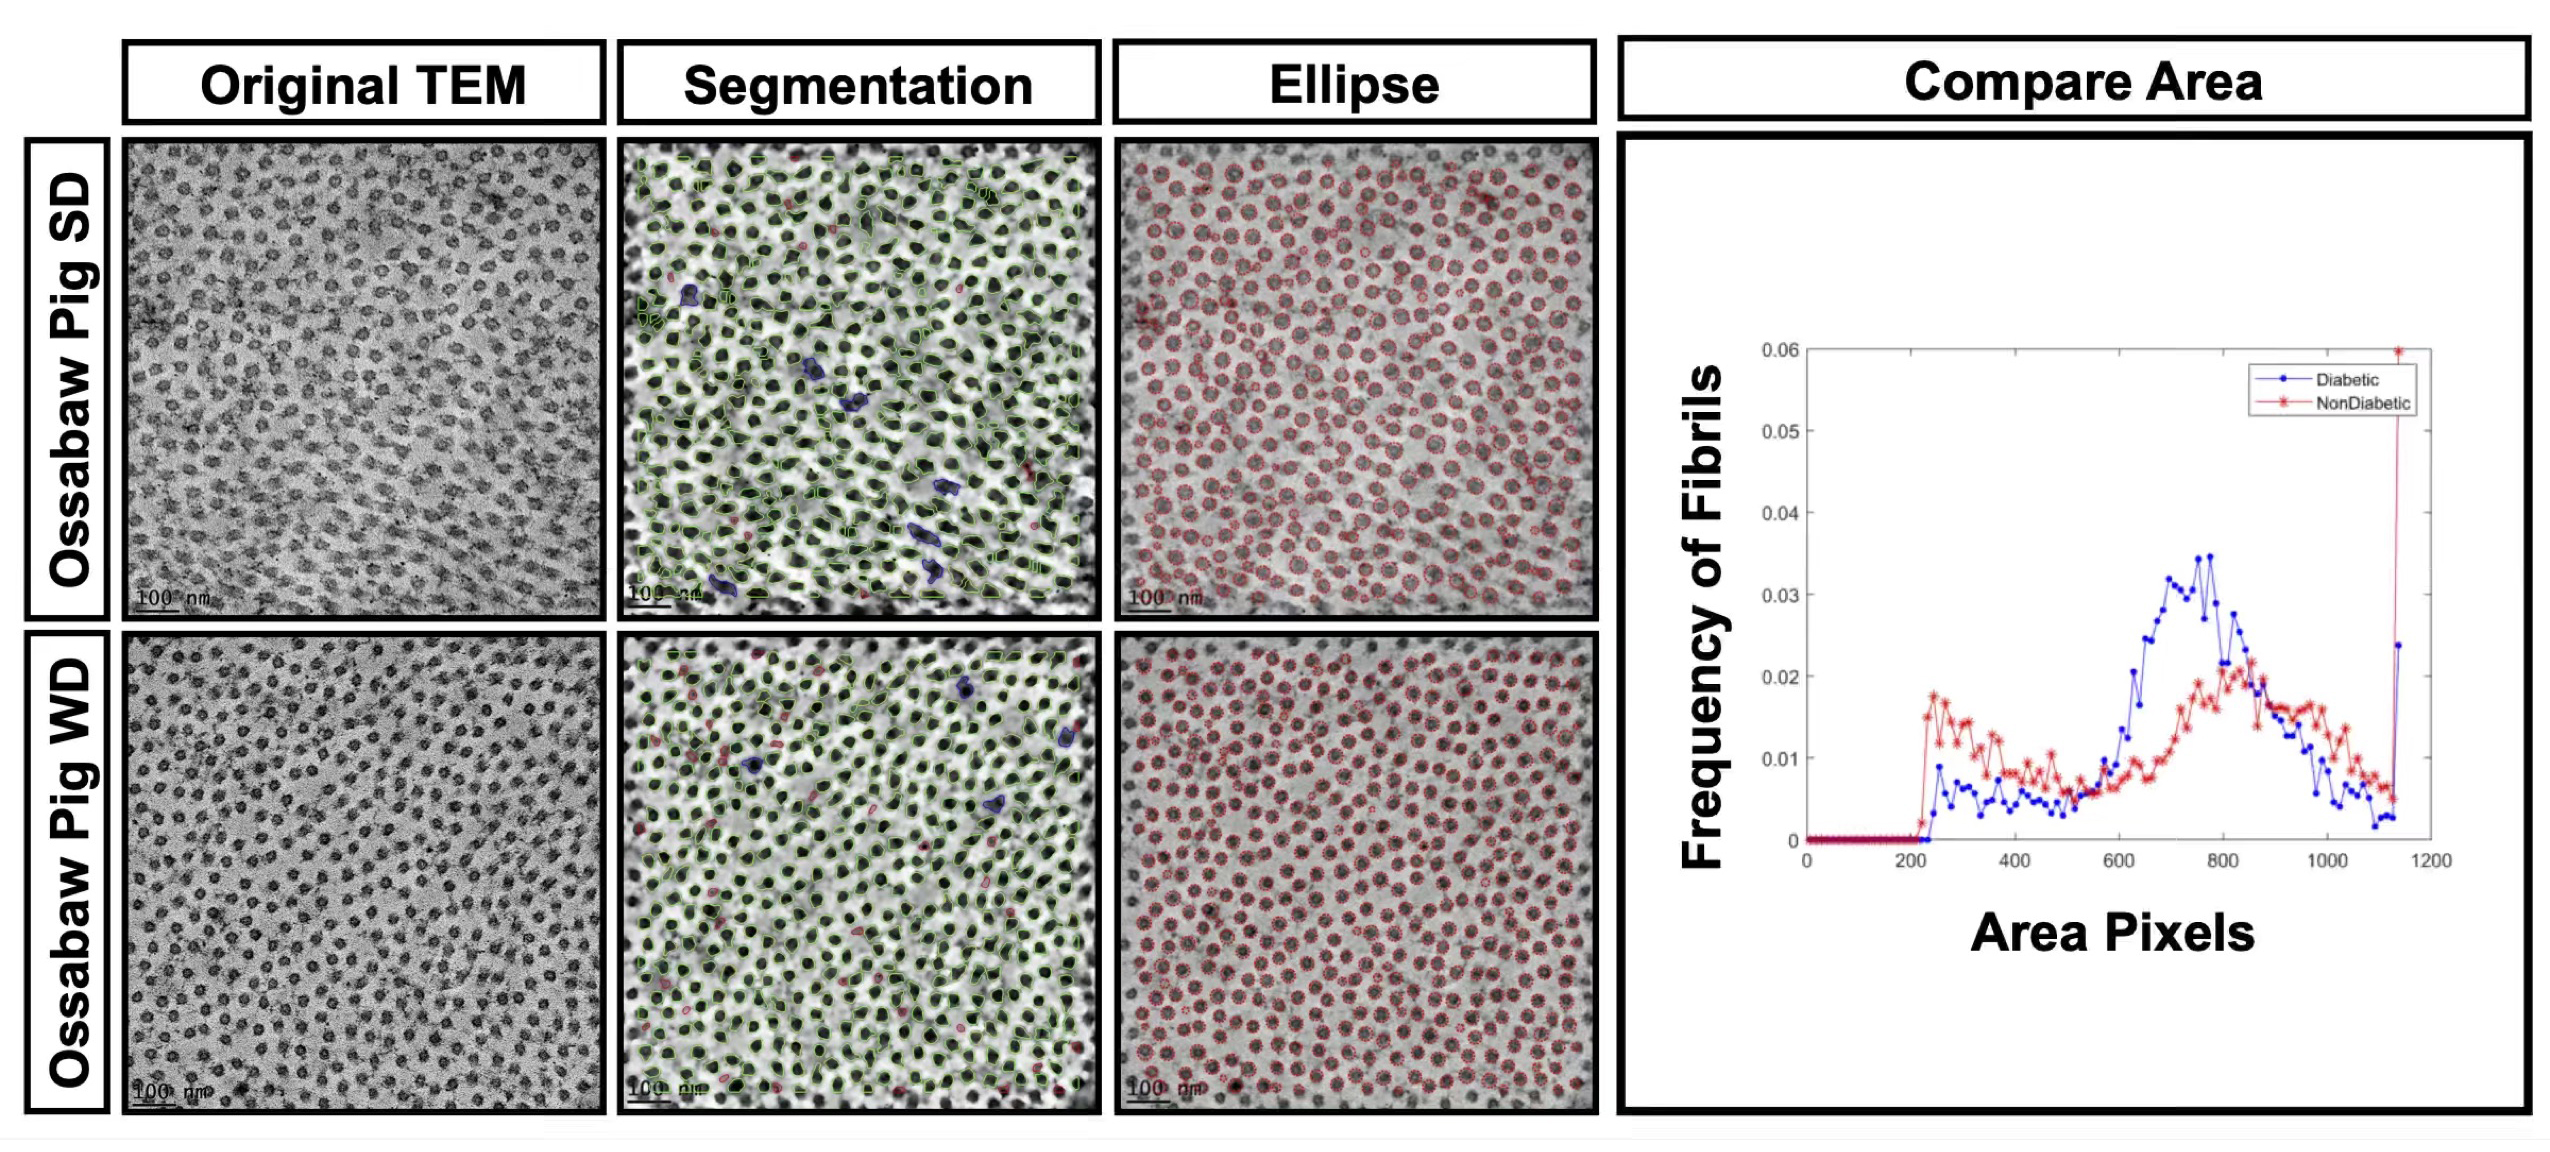
 Figure 6 of
Sinha, Mol Vis 2021; 27:666-678.
Figure 6 of
Sinha, Mol Vis 2021; 27:666-678.