Figure 6 of
Moura, Mol Vis 2021; 27:656-xxx.
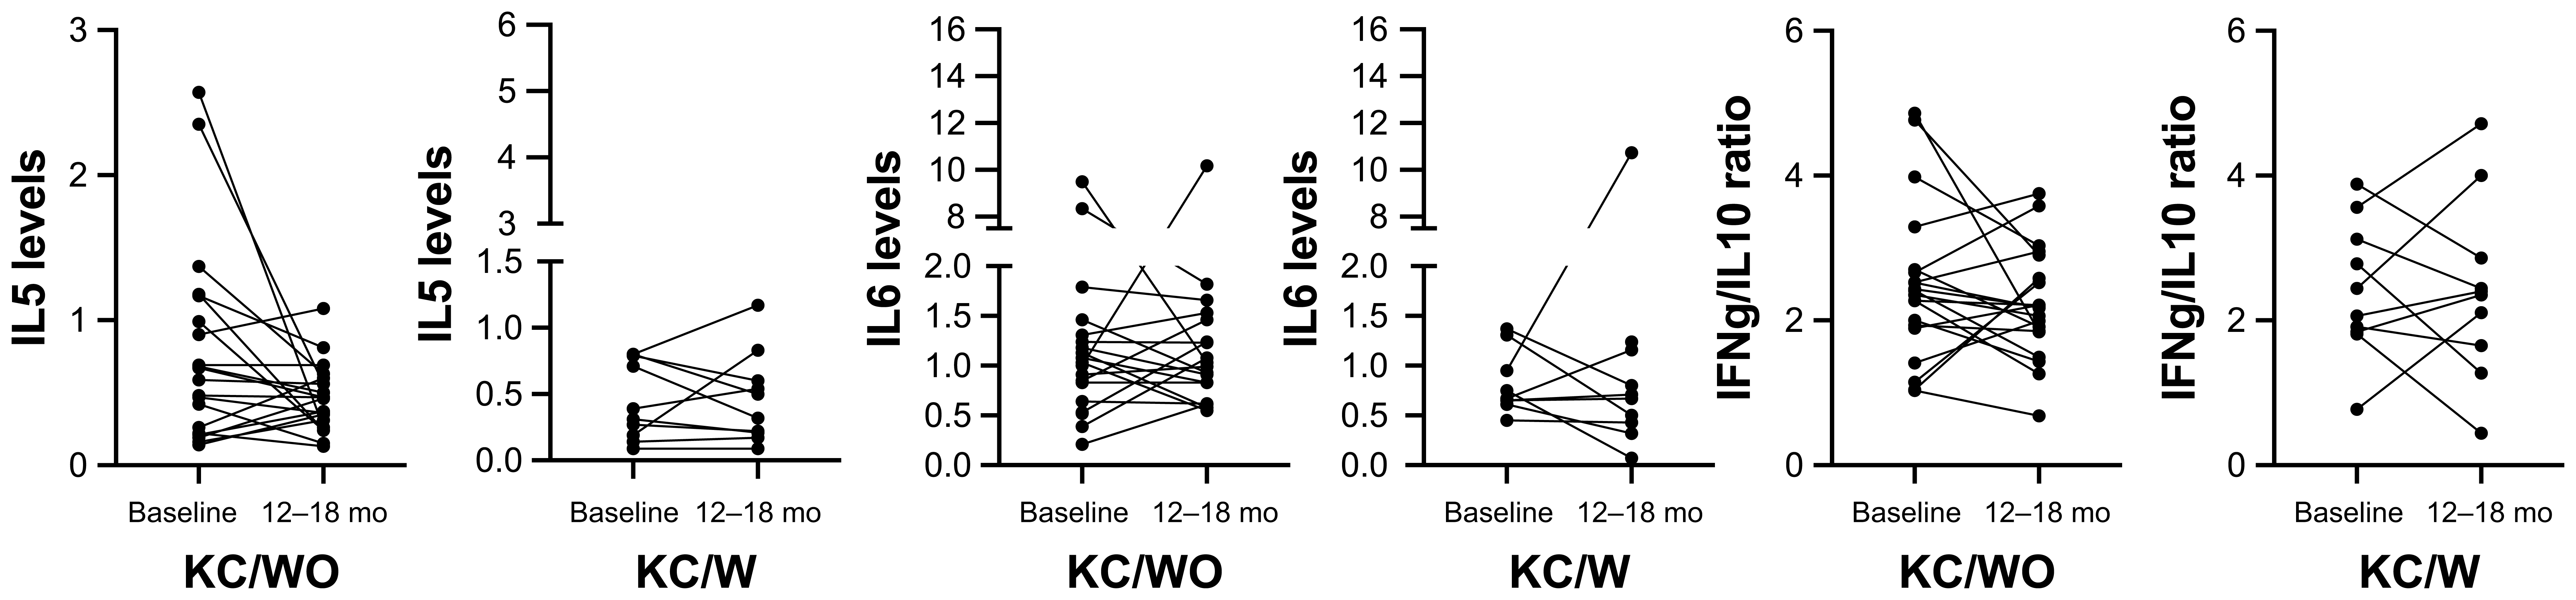
Figure 6.
IL-5, IL-6, and IFN-γ to IL-10 ratio levels in the KC group according to disease status (with or without progression) over time.
 Figure 6 of
Moura, Mol Vis 2021; 27:656-xxx. Figure 6 of
Moura, Mol Vis 2021; 27:656-xxx.
Figure 6 of
Moura, Mol Vis 2021; 27:656-xxx. Figure 6 of
Moura, Mol Vis 2021; 27:656-xxx.